# 基本知识
# JVM是啥?
类型:hotspot vm / OpenJ9
JVM是一份本地化的程序,本质上是可执行的文件-/jre/bin/server/jvm.dll,是静态的概念。
程序运行起来成为进程,是动态的概念。java程序是跑在JVM上的,严格来讲,是跑在JVM实例上的,一个JVM实例其实就是JVM跑起来的进程,二者合起来称之为一个JAVA进程。各个JVM实例之间是相互隔离的。
通常编程打包的程序都是直接到机器码,比如exe文件是windows的机器码可执行文件,Java语言设计只默认编译成中间语言byte code字节码,不编译成最终的机器码,然后jvm就会去解释执行),实际上不只是java语言,任何语言只要能转成bytecode 字节码都可以交由jvm加载,jvm会找到主程序并根据当前的操作系统解释成机器码运行
Notes:
JVM VS Python VM JAVA需要经过一次编译成class文件,然后交给JVM跑,Python不需要编译,直接py交给PVM解释运行 (opens new window)
JAVA VS C++ Java 像是一辆自动挡汽车。你只需要挂 D 挡(用 synchronized)或 S 挡(用 volatile),汽车(JVM)会自动帮你处理换挡(内存屏障)、离合(缓存同步)等复杂操作。你很容易开,但无法精细控制引擎转速。 C++ 像是一辆手动挡赛车。它有离合器、档杆(不同的内存序)。你可以通过精准的跟趾动作、降档补油来榨取极限性能。但如果你操作不当,很容易熄火(数据竞争)甚至损坏发动机(程序崩溃)。
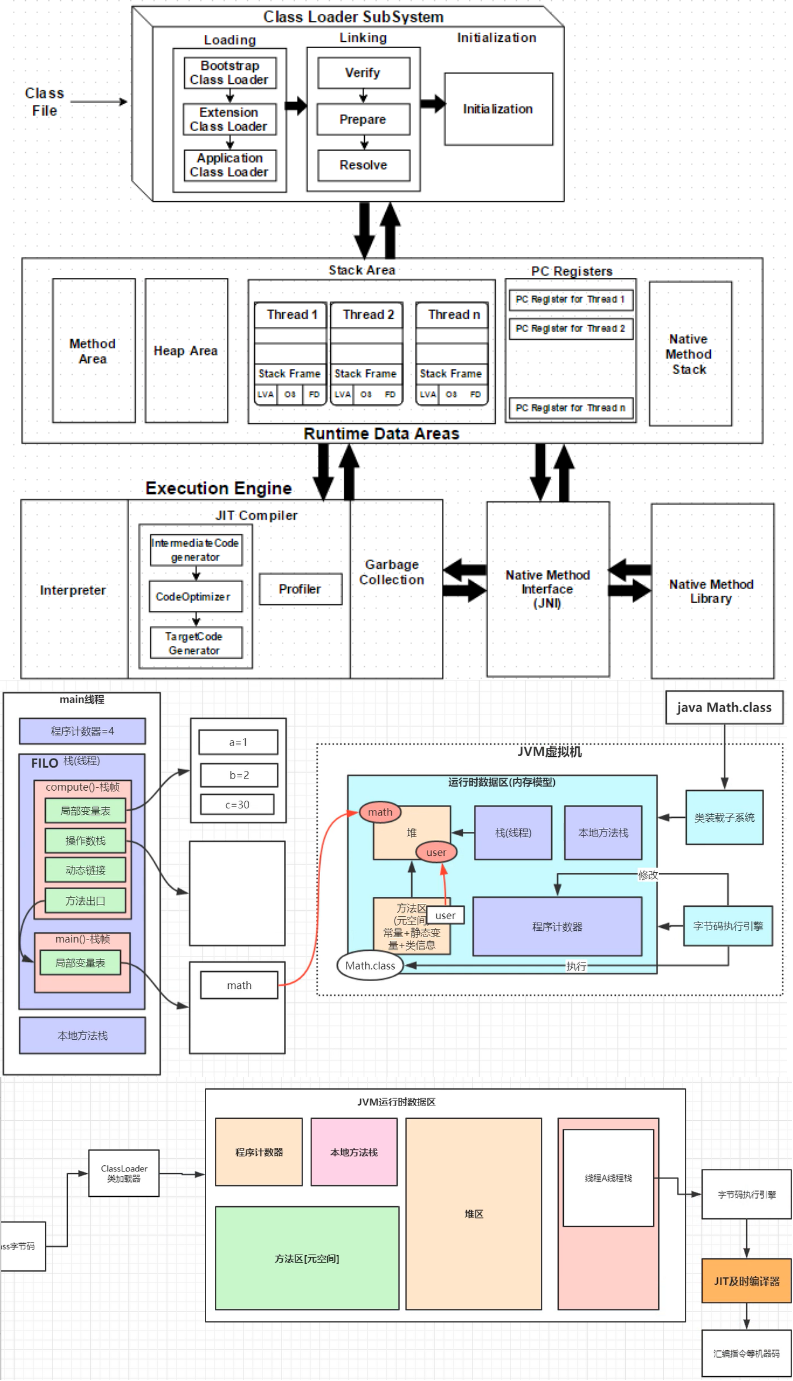
JVM内存布局
├── 堆内存 (Heap) - 对象实例存储区
│   ├── 新生代 (Young Generation) - 新创建对象
│   │   ├── Eden区 (伊甸园) - 对象诞生地
│   │   └── Survivor区 (幸存者区)
│   │       ├── Survivor 0 (From区)
│   │       └── Survivor 1 (To区)
│   └── 老年代 (Old Generation) - 长期存活对象
│
├── 方法区 (Method Area) - 类信息、常量池
│   └── 运行时常量池
├── 元空间 (Metaspace) - JDK8+替代永久代
│
└── 非堆内存
    ├── 虚拟机栈 (VM Stack) - 线程私有
    ├── 本地方法栈 (Native Stack)
    └── 程序计数器 (Program Counter)
# "编译"这个词在Java中有三个不同层次的含义
- 前端编译:Java源码 → 字节码(.java → .class)
工具:
javac SimpleCalculator.java首先需要编译器将高级的.java程序文件编译成.class类文件,内容即byte code字节码指令/jvm指令(这段.class文件是一段包含着虚拟机指令、程序和数据片段的二进制文件,即字节码,为什么叫字节码?因为这种类型的代码以一个字节8bit为最小单位储存),然后聚合类文件、相关元数据和资源到同一个文件,以.jar为扩展名 字节码引擎对应jvm指令:Java bytecode instruction listings (opens new window) - JIT编译:字节码 → 本地机器码(运行时) 工具:JVM的JIT编译器(C1、C2等) 位置:JVM内部的代码缓存(Code Cache)
- AOT编译:Java源码 → 本地机器码(提前编译)
# 这是GraalVM等支持的提前编译
native-image SimpleCalculator
# 生成可直接执行的本地二进制文件
# 更新历史
JDK 1.0 (1996) - 初代JVM,解释执行
  ↓
JDK 1.1 (1997) - JIT编译器引入
  ↓
JDK 1.2 (1998) - HotSpot VM诞生
  ↓
JDK 1.3 (2000) - HotSpot成为默认VM
  ↓
JDK 1.4 (2002) - 性能优化期
  ↓
JDK 5 (2004) - 监控和管理增强
  ↓
JDK 6 (2006) - 脚本语言支持
  ↓
JDK 7 (2011) - G1 GC引入
  ↓
JDK 8 (2014) - 元空间取代永久代
  ↓
JDK 9 (2017) - 模块化系统
  ↓
JDK 11 (2018) - ZGC、Epsilon GC
  ↓
JDK 17 (2021) - LTS版本,性能大幅提升
# jvm运行全流程
操作系统层面的启动过程
//用户在终端执行: java SimpleCalculator
//操作系统执行步骤:
完整JVM执行流程(从操作系统到Java程序):
┌─────────────────────────────────────────────────────────────┐
│                       操作系统层面                           │
│ 1. shell解析java SimpleCalculator命令                     │
│ 2. 调用execve()系统调用创建新进程                          │
│ 3. 加载JVM可执行文件到内存                                │
│ 4. CPU程序计数器指向JVM入口点                            │
└───────────────────────┬─────────────────────────────────────┘
                        ↓
┌─────────────────────────────────────────────────────────────┐
│                       JVM初始化阶段 (C++代码)                        │
│ 1. 分配堆内存、方法区、栈内存                             │
│ 2. 创建系统线程(GC、Finalizer等)                        │
│ 3. 初始化类加载器子系统                                   │
│ 4. 创建主线程执行环境                                    │
└───────────────────────┬─────────────────────────────────────┘
                        ↓
┌─────────────────────────────────────────────────────────────┐
│                      类加载阶段                             │
│ 1. 加载SimpleCalculator.class文件                        │
│ 2. 验证、准备、解析、初始化                               │
│ 3. 类信息存入方法区,静态变量初始化                       │
│ 4. 找到main方法入口地址                                  │
└───────────────────────┬─────────────────────────────────────┘
                        ↓
┌─────────────────────────────────────────────────────────────┐
│                   线程和栈帧创建阶段                        │
│ 1. 创建主线程栈空间                                     │
│ 2. 创建main方法栈帧(局部变量表、操作数栈)               │
│ 3. 程序计数器指向main方法第一条字节码                     │
└───────────────────────┬─────────────────────────────────────┘
                        ↓
┌─────────────────────────────────────────────────────────────┐
│                     字节码执行阶段                          │
│ 1. 解释器逐条解释字节码                                  │
│ 2. 方法调用时创建新栈帧,返回时销毁                       │
│ 3. 程序计数器在字节码间移动                              │
└───────────────────────┬─────────────────────────────────────┘
                        ↓
┌─────────────────────────────────────────────────────────────┐
│                    JIT编译优化阶段                         │
│ 1. 热点代码检测(方法调用计数)                           │
│ 2. JIT编译器将热点字节码编译为本地机器码                  │
│ 3. 后续调用直接执行机器码                                │
└───────────────────────┬─────────────────────────────────────┘
                        ↓
┌─────────────────────────────────────────────────────────────┐
│                      机器码执行阶段                         │
│ 1. CPU直接执行编译后的本地代码                            │
│ 2. 栈帧结构保持不变,但执行方式改变                       │
└───────────────────────┬─────────────────────────────────────┘
                        ↓
┌─────────────────────────────────────────────────────────────┐
│                      程序结束阶段                           │
│ 1. main方法执行完毕返回                                 │
│ 2. JVM清理资源,终止进程                                │
│ 3. 操作系统回收进程资源                                 │
└─────────────────────────────────────────────────────────────┘
JVM进程 vs Java线程
操作系统层面:
JVM进程 = 一个完整的Java虚拟机实例
├── 进程ID: 1234
├── 内存空间: 包含所有内存区域(堆、方法区、栈等)
├── 执行文件: java可执行程序(C++编写)
└── 系统线程: JVM内部线程(GC、编译器等)
JVM层面:
Java线程 = JVM内部管理的执行单元
├── 主线程: 执行main方法的线程
├── 工作线程: 用户创建的其他线程
└── 系统线程: JVM内部的守护线程
# 编译字节码
// SimpleCalculator.java
public class SimpleCalculator {
    private static int classCounter = 0;  // 静态变量
    private int instanceCounter;           // 实例变量

    public SimpleCalculator() {
        classCounter++;
        this.instanceCounter = classCounter;
        System.out.println("创建第" + instanceCounter + "个计算器实例");
    }

    public int add(int a, int b) {
        int result = a + b;
        System.out.println(a + " + " + b + " = " + result);
        return result;
    }

    public native double sqrt(double x);  // 本地方法

    public static void main(String[] args) {
        System.out.println("=== 程序开始执行 ===");

        SimpleCalculator calc = new SimpleCalculator();
        int sum = calc.add(5, 3);

        System.out.println("=== 程序执行结束 ===");
    }
}
编译后的字节码文件结构
SimpleCalculator.class
├── 魔数: CAFEBABE
├── 版本号: JDK 8 (52.0)
├── 常量池(Constant Pool)
├── 访问标志: ACC_PUBLIC, ACC_SUPER
├── 类索引、父类索引
├── 字段表: classCounter, instanceCounter
└── 方法表:
main方法的完整字节码:
public static void main(java.lang.String[]);
  descriptor: ([Ljava/lang/String;)V
  flags: ACC_PUBLIC, ACC_STATIC
  Code:
    stack=2, locals=3, args_size=1

    // PC=0: 创建新对象
    0: new           #2                  // class SimpleCalculator
    // ↑ PC指针指向0,操作码new,操作数#2(指向常量池中的类引用)

    // PC=3: 复制栈顶引用
    3: dup
    // ↑ 复制对象引用,现在栈顶有两个相同的引用

    // PC=4: 调用构造函数
    4: invokespecial #3                  // Method "<init>":()V
    // ↑ 消耗一个引用,调用构造函数

    // PC=7: 存储到局部变量表
    7: astore_1
    // ↑ 将剩余的对象引用存入局部变量表索引1(calc变量)

    // PC=8: 加载calc引用
    8: aload_1
    // ↑ 从局部变量表加载calc引用到操作数栈

    // PC=9: 加载常数5
    9: iconst_5
    // ↑ 将整数5压入操作数栈

    // PC=10: 加载常数3
    10: iconst_3
    // ↑ 将整数3压入操作数栈

    // PC=11: 调用add方法
    11: invokevirtual #4                 // Method add:(II)I 注意invokevirtual会检查该方法有没有进行jit编译优化,如果没有则解释执行,如果有则直接执行机器码
    // ↑ 调用add方法,消耗calc引用和两个参数

    // PC=14: 存储结果
    14: istore_2
    // ↑ 将方法返回值存入局部变量表索引2(sum变量)

    // PC=15: 返回
    15: return
    // ↑ 方法结束,返回void
构造函数
// 构造函数的字节码
public SimpleCalculator();
  descriptor: ()V
  flags: ACC_PUBLIC
  Code:
    stack=2, locals=1, args_size=1

    // PC=0: 调用父类(Object)构造函数
    0: aload_0
    1: invokespecial #1  // Method java/lang/Object."<init>":()V

    // PC=4: 静态变量classCounter自增
    4: getstatic     #2  // Field classCounter:I
    7: iconst_1
    8: iadd
    9: putstatic     #2  // Field classCounter:I

    // PC=12: 设置实例变量instanceCounter
    12: aload_0
    13: getstatic     #2  // Field classCounter:I
    16: putfield      #3  // Field instanceCounter:I

    // PC=19: 返回
    19: return
add方法字节码分析
// add方法的字节码
public int add(int, int);
  descriptor: (II)I
  flags: ACC_PUBLIC
  Code:
    stack=2, locals=4, args_size=3

    // 方法参数: this(隐含), a, b
    // 局部变量: this, a, b, result

    // PC=0: 加载参数a
    0: iload_1        // 加载局部变量1(a)到操作数栈

    // PC=1: 加载参数b
    1: iload_2        // 加载局部变量2(b)到操作数栈

    // PC=2: 相加
    2: iadd           // 栈顶两个整数相加

    // PC=3: 存储到result变量
    3: istore_3       // 结果存入局部变量3(result)

    // PC=4: 返回结果
    4: iload_3        // 加载result到操作数栈
    5: ireturn        // 返回整数
# 内存布局示意图
# 第一层 操作系统
进程地址空间布局:
0x00000000-0x3FFFFFFF: 内核空间(操作系统)
0x40000000-0x4000FFFF: JVM代码段(text)
0x60000000-0x6000FFFF: JVM数据段(data)
0x80000000-0x8FFFFFFF: 堆初始区域
0x7FFF0000-0x7FFFFFFF: 栈初始区域
执行步骤:
命令解析:shell接收到java SimpleCalculator命令
进程创建:调用fork()+ execve()系统调用
加载可执行文件:将JVM可执行文件映射到进程地址空间
设置执行上下文:CPU程序计数器指向JVM入口地址
权限切换:从用户态切换到内核态执行加载,再切回用户态执行JVM代码
# 第二层 JVM
JVM内部数据结构创建
JVM内存管理器初始化:
├── 堆内存(Heap)
│   ├── 年轻代(Eden + Survivor)
│   └── 老年代(Old Generation)
├── 方法区(Method Area)
│   ├── 类信息存储
│   ├── 运行时常量池
│   └── 静态变量区 ←【修正:静态变量完全在此处】
└── 线程管理系统
    ├── 主线程(Main Thread)
    ├── VM线程(系统任务)
    ├── GC线程(垃圾回收)
    └── 其他系统线程
关键初始化步骤:
内存分配:根据Xmx、Xms参数分配堆内存
线程创建:创建并启动系统守护线程
类加载器初始化:创建Bootstrap、Extension、Application类加载器
执行引擎准备:初始化解释器和JIT编译器
主线程创建:设置主线程栈空间和初始PC值
# 第三层:类加载阶段详细过程
Bytecode (.classfile content): Contains method bodies as JVM instructions (e.g., aload_0, invokevirtual), constant pool entries, and metadata descriptors. It is a binary format, but it is not directly executable machine code.
Class Metadata in Metaspace: When the JVM loads a .classfile, it parses the bytecode and creates internal C++ objects (like InstanceKlass, Method, ConstantPool) that represent the class structure. This metadata is stored in native memory structures, not as raw bytecode. The JVM uses this metadata to verify, link, and execute the bytecode.
Analogy: Bytecode = The blueprint instructions for building a car engine.
Class Metadata = The factory’s master specification sheet (materials, dimensions, assembly steps) derived from the blueprint. The factory (JVM) doesn’t re-read the blueprint for every engine; it uses the master sheet.
类加载双亲委派模型:
类加载流程:
Application ClassLoader收到加载SimpleCalculator请求
    ↓
委派给Extension ClassLoader
    ↓
委派给Bootstrap ClassLoader
    ↓
Bootstrap尝试加载(失败,非核心类)
    ↓
Extension尝试加载(失败,非扩展类)
    ↓
Application ClassLoader从classpath加载
- 方法区(Method Area) - 类级别信息
方法区内容(类级别,所有线程共享):
┌─────────────────────────────────────────────────┐
│              SimpleCalculator类元数据             │
├─────────────────────────────────────────────────┤
│ 类信息:                                         │
│   - 类名: SimpleCalculator                     │
│   - 访问标志: public                           │
│   - 父类: java.lang.Object                    │
├─────────────────────────────────────────────────┤
│ 方法定义(代码本身):                            │
│   - main方法: 字节码指令                        │
│     [new, dup, invokespecial, aload_1, ...]   │
│   - add方法: 字节码指令                         │
│     [iload_1, iload_2, iadd, ireturn]          │
│   - <init>构造方法: 字节码指令                   │
│     [aload_0, invokespecial, ...]              │
├─────────────────────────────────────────────────┤
│ 字段定义:                                       │
│   - classCounter: static int                  │
│   - instanceCounter: int                      │
├─────────────────────────────────────────────────┤
│ 常量池:                                         │
│   - 字符串字面量: "=== 程序开始执行 ==="等        │
│   - 类引用: SimpleCalculator, System等          │
└─────────────────────────────────────────────────┘

方法区详细布局 (JVM数据段内):
0x60010000: SimpleCalculator类结构
    ├── 0x60010004: 方法表指针 → 0x60012000
    ├── 0x60010008: 常量池指针 → 0x60013000
    └── 0x6001000C: 静态变量classCounter = 0

0x60012000: 方法表
    ├── 0x60012004: <init>方法字节码地址 → 0x60015000
    ├── 0x60012008: add方法字节码地址 → 0x60016000
    └── 0x6001200C: main方法字节码地址 → 0x60017000

0x60013000: 常量池
    ├── #1: Class SimpleCalculator
    ├── #2: Field classCounter
    ├── #3: Method <init>
    └── #4: Method add
# 第四层:执行主方法阶段详细过程
Java虚拟机栈(Java Virtual Machine Stack) - 线程执行
main线程私有内存区域:
┌─────────────────────────────────────────────────┐
│               main线程                          │
├─────────────────────────────────────────────────┤
│ 程序计数器(PC): 0x700C (指向下条指令地址)        │
├─────────────────────────────────────────────────┤
│ Java虚拟机栈(Stack):                            │
│   ┌─────────────────────────────────────────┐   │
│   │          当前栈帧: main方法             │   │   ← 栈顶
│   │   ┌─────────────────────────────────┐   │   │
│   │   │ 局部变量表(Local Variables)      │   │   │
│   │   │   [0] args: String[]@0x2000      │   │   │
│   │   │   [1] calc: SimpleCalculator@0x1000│   │   │
│   │   │   [2] sum: 8                     │   │   │
│   │   └─────────────────────────────────┘   │   │
│   │   ┌─────────────────────────────────┐   │   │
│   │   │ 操作数栈(Operand Stack)         │   │   │
│   │   │   当前: 空                      │   │   │
│   │   └─────────────────────────────────┘   │   │
│   │   ┌─────────────────────────────────┐   │   │
│   │   │ 动态链接 → main方法在方法区的引用 │   │   │
│   │   └─────────────────────────────────┘   │   │
│   │   ┌─────────────────────────────────┐   │   │
│   │   │ 返回地址 → 操作系统调用入口      │   │   │
│   │   └─────────────────────────────────┘   │   │
│   └─────────────────────────────────────────┘   │
│                                                 │
│   ┌─────────────────────────────────────────┐   │
│   │          之前栈帧: add方法              │   │   ← 已销毁
│   │           (方法调用结束后弹出栈)         │   │
│   └─────────────────────────────────────────┘   │
├─────────────────────────────────────────────────┤
│ 本地方法栈(Native Method Stack):                 │
│   - 用于JNI调用本地代码                         │
└─────────────────────────────────────────────────┘

主线程栈帧布局 (栈地址从高到低):

0x7FFFFFF0: main方法栈帧
├── 局部变量表(Local Variables):
│   0x7FFFFFE8: args[0] = 参数数组引用
│   0x7FFFFFEC: calc[1] = 0x8000(堆中对象地址)
│   0x7FFFFFF0: sum[2] = 8(方法返回值)
│
├── 操作数栈(Operand Stack):
│   执行add方法前: [0x8000(calc引用), 5, 3]
│   执行add方法后: [8(返回值)]
│
└── 栈帧数据:
    返回地址: 0x15(main方法的下一条指令)
    动态链接: 指向方法区的符号引用
堆内存(Heap) - 对象实例
堆内容(对象实例,所有线程共享):
┌─────────────────────────────────────────────────┐
│              对象实例存储区                        │
├─────────────────────────────────────────────────┤
│ SimpleCalculator实例 @0x1000:                   │
│   ┌─────────────────────────────────────────┐   │
│   │ 对象头 (Mark Word)                      │   │
│   │   - 哈希码、GC年龄、锁状态等              │   │
│   ├─────────────────────────────────────────┤   │
│   │ 类型指针 → 指向方法区的SimpleCalculator类 │   │
│   ├─────────────────────────────────────────┤   │
│   │ 实例数据:                               │   │
│   │   - instanceCounter: 1                 │   │
│   └─────────────────────────────────────────┘   │
│                                                 │
│ 静态变量存储区:                                  │
│   - classCounter: 1 (静态变量完全存储在方法区,包括变量名和值都在方法区)  │
└─────────────────────────────────────────────────┘

对象创建过程:
1. new指令执行时:
   堆地址 0x8000: 分配SimpleCalculator对象
   ├── 对象头(Mark Word): 0x8000-0x8007
   ├── 类型指针: 指向 0x60010000(方法区中的类)
   └── 实例数据: instanceCounter(初始值0)

2. 构造函数执行后:
   0x8008: instanceCounter = 1
PC寄存器(Program Counter Register)工作流程
时间线执行过程:

时间点 T0 (PC=0x60017000):
  当前线程: main线程
  PC寄存器: 0x60017000 (main方法字节码起始)
  执行: new #2 → 在堆 0x8000 创建对象
  方法区查找: 通过常量池#2找到类信息(0x60010000)

时间点 T1 (PC=0x60017003):
  PC寄存器: 0x60017003
  执行: dup → 复制对象引用

时间点 T2 (PC=0x60017004):
  PC寄存器: 0x60017004
  执行: invokespecial #3 → 调用构造函数
  方法查找: 通过常量池#3找到<init>方法(0x60015000)

时间点 T3 (PC=0x60017007):
  PC寄存器: 0x60017007
  执行: astore_1 → 存储到局部变量calc

时间点 T4 (PC=0x60017008):
  PC寄存器: 0x60017008
  执行: aload_1 → 加载calc引用

时间点 T5 (PC=0x6001700B):
  当前线程: main线程(同一个!)
  PC寄存器: 0x6001700B
  执行: invokevirtual #4 → 调用add方法
  方法查找: 通过常量池#4找到add方法(0x60016000)
  PC跳转: 0x6001700B → 0x60016000
  .....
执行过程内存状态变化图
初始状态:
PC=0x60017000, 栈帧空, 堆空

执行new指令后:
PC=0x60017003, 堆0x8000创建对象, 操作数栈:[0x8000]
类型指针指向: 0x60010000(方法区类结构)

执行invokespecial后:
PC=0x60017007, 构造函数完成, 对象初始化完成
静态变量classCounter在方法区0x6001000C处更新为1

执行add方法时:
PC=0x60016000(add方法), 新栈帧创建, 局部变量表:[this=0x8000, a=5, b=3]
add方法字节码从方法区0x60016000读取

方法返回后:
PC=0x6001700E(main方法), add栈帧销毁, 操作数栈:[8]
# 执行细节
解释器在JVM代码段(0x40000000)中工作:
解释器执行main方法流程:
1. PC: 0x60017000 (main方法字节码在方法区)
2. 解释器代码: 0x40001000 (在JVM代码段)
3. 取指: 从方法区0x60017000读取字节码
4. 执行: 在JVM代码段执行对应的机器码
5. 更新PC: 根据指令长度更新
方法调用时的地址转换:
调用add方法时的地址流程:
1. PC当前: 0x6001700B (main方法中的invokevirtual指令)
2. 通过常量池#4查找: 找到add方法在方法区0x60016000
3. 创建新栈帧: 在栈区域0x7FFF0000分配
4. PC跳转: 0x6001700B → 0x60016000 (add方法字节码)
JIT编译过程
编译前后的地址变化:
编译前(解释执行):
方法字节码地址: 0x60016000 (在方法区)
执行路径: PC → 解释器(0x40001000) → 字节码执行

编译后(直接执行):
机器码地址: 0x60002000 (在JVM数据段的代码缓存区)
执行路径: PC → 直接跳转到0x60002000执行机器码
代码缓存区在JVM数据段中的位置:
JVM数据段详细布局:
0x60000000-0x6000FFFF: JVM内部数据结构
0x60001000-0x60011FFF: 方法区(Method Area) ← 新增!
0x60012000-0x6001FFFF: 代码缓存区(Code Cache)

代码缓存区内容:
0x60012000: 编译后的add方法机器码
0x60012020: 编译后的热点方法2机器码
0x60012040: 编译后的热点方法3机器码
热点检测和编译触发
方法调用计数器在JVM数据段:
方法调用计数器表(在JVM数据段0x60000000):
0x60000000: add方法计数器
    ├── 方法地址: 0x60016000
    ├── 调用次数: 10000 (达到阈值!)
    └── 编译后地址: 0x60012000 (代码缓存)

0x60000010: main方法计数器
    ├── 方法地址: 0x60017000
    ├── 调用次数: 1
    └── 编译后地址: 0x00000000 (未编译)
JIT编译触发过程:
1. add方法第10000次调用时:
   - 计数器更新: 0x60000000处的值从9999→10000
   - 触发编译: JIT编译器(代码段0x40003000)启动

2. 编译过程:
   - 输入: 方法区中的字节码(0x60016000)
   - 处理: JIT编译器代码(0x40003000)
   - 输出: 机器码存入代码缓存(0x60012000)

3. 元数据更新:
   - 方法表更新: 0x60012008处的add方法条目指向0x60012000
   - 后续调用直接跳转到编译后代码
从解释执行到CPU执行的路径:
// 最底层的执行路径
void execute_java_method(Method* method) {
    if (method->is_compiled) {
        // 编译执行:直接跳转到机器码
        // 底层是汇编指令:jmp [method->compiled_entry]
        asm_jump_to_compiled_code(method->compiled_entry);
    } else {
        // 解释执行:调用解释器函数
        // 底层是C++函数调用
        interpreter.interpret(method->bytecode);
    }
}

// 解释器内部的循环
void Interpreter::interpret(byte* bytecode) {
    while (true) {
        byte opcode = *bytecode++;
        switch (opcode) {
            case IADD: {
                // 这些C++操作最终都编译为机器指令
                int a = pop();
                int b = pop();
                push(a + b);
                break;
            }
            // ...
        }
    }
}
解释器运行在当前Java线程的上下文中(执行引擎不是独立线程,而是被Java线程调用的功能模块)
从OS线程到Java线程的映射

// JVM的线程实现(C++代码)
class JavaThread {
private:
    pthread_t os_thread;     // 底层操作系统线程
    ThreadState state;       // 线程状态
    address pc;              // 程序计数器(Java字节码地址)
    Stack* stack;           // Java栈
    // ... 其他线程上下文信息

public:
    void run() {
        // 操作系统调度器选择这个线程执行
        while (true) {
            // 获取当前字节码指令
            byte opcode = read_byte(pc);

            // 调用解释器执行(在当前OS线程上下文中)
            Interpreter::execute_bytecode(this, opcode);
        }
    }
};

执行时刻:main线程执行到calc.add(5, 3)

线程上下文:
┌─────────────────────────────────────────────────┐
│                main线程执行环境                 │
├─────────────────────────────────────────────────┤
│ 硬件层面:                                      │
│   - CPU寄存器: 指向当前执行地址                 │
│   - 栈指针: 指向main线程栈顶                   │
│   - PC寄存器: 指向invokevirtual指令地址         │
│                                                │
│ JVM层面:                                       │
│   - 线程控制块: 存储线程状态、PC值等            │
│   - Java栈: 包含main方法栈帧                   │
│   - 局部变量表: [args, calc, 未初始化]         │
│   - 操作数栈: [calc引用, 5, 3]                 │
└─────────────────────────────────────────────────┘

解释器执行时的详细过程:

// JVM内部的invokevirtual处理函数(C++代码)
void Interpreter::invokevirtual(Thread* current_thread, int method_index) {
    // current_thread参数就是当前执行的Java线程
    // 对于main方法调用add方法,current_thread就是main线程

    // 1. 从当前线程的栈帧中获取参数
    StackFrame* frame = current_thread->get_current_frame();
    Object* receiver = frame->pop_operand();  // calc引用
    int arg1 = frame->pop_operand();           // 5
    int arg2 = frame->pop_operand();           // 3

    // 2. 查找方法
    Method* method = resolve_method(method_index);

    // 3. 在当前线程中创建新栈帧
    StackFrame* new_frame = current_thread->push_frame(method);
    new_frame->set_local(0, receiver);  // this = calc
    new_frame->set_local(1, arg1);      // a = 5
    new_frame->set_local(2, arg2);      // b = 3

    // 4. 更新当前线程的PC寄存器
    current_thread->set_pc(method->bytecode_address);

    // 5. 开始解释执行(在当前线程上下文中)
    interpret_method(current_thread, method);
}
# 第五层:程序结束阶段详细过程
资源清理顺序:
Java层面清理:执行finalize方法(如果重写)
JVM层面清理:销毁线程、释放堆内存
操作系统层面:解除内存映射,回收进程资源
# jvm概念拆解
# JVM 的线程是用户态线程还是内核态线程?
【解析】 JVM 自己本身有一个线程模型。在 JDK 1.1 的时候,JVM 自己管理用户级线程。这样做缺点非常明显,操作系统只调度内核级线程,用户级线程相当于基于操作系统分配到进程主线程的时间片,再次拆分,因此无法利用多核特性。
为了解决这个问题,后来 Java 改用线程映射模型,因此,需要操作系统支持。在 Windows 上是 1 对 1 的模型,在 Linux 上是 n 对 m 的模型。顺便说一句,Linux 的PThreadAPI 创建的是用户级线程,如果 Linux 要创建内核级线程有KThreadAPI。映射关系是操作系统自动完成的,用户不需要管。
在JVM中运行的线程与Linux内核之间的关系是一个复杂但重要的概念。首先,需要澄清的是,JVM管理的线程(即Java线程)与操作系统(如Linux)的线程之间并不是完全隔离的,它们之间存在紧密的交互。
JVM线程与操作系统线程的关系 一对一模型:
在许多现代JVM实现中,特别是HotSpot JVM,Java线程与操作系统的本地线程(在Linux中通常是轻量级进程)之间存在一对一的映射关系。这意味着每当在Java中创建一个新线程时,JVM都会请求操作系统创建一个新的本地线程12。 在这种模型下,Java线程的调度、创建、销毁以及上下文切换等操作都是由操作系统内核来管理的。JVM本身并不直接进行这些操作,而是依赖于操作系统提供的API和机制12。 线程创建与销毁:
当Java程序创建一个新线程时,JVM会调用操作系统的API(如Linux中的pthread_create)来创建一个新的本地线程。这个过程中,操作系统会为线程分配必要的资源,如内存和堆栈空间12。 类似地,当Java线程结束时,JVM会请求操作系统销毁相应的本地线程,并回收其占用的资源3。 线程调度:
线程的调度(即决定哪个线程在何时运行)完全由操作系统内核负责。Java线程的优先级设置可能会反映为底层操作系统线程的优先级设置,但这不是一个严格的一一对应关系4。 在Java中,线程的调度通常是基于抢占式的,这意味着优先级更高的线程更可能被操作系统选中执行,但它并不能保证一定会被执行3。 上下文切换:
当操作系统需要从一个线程切换到另一个线程时(例如,由于时间片用完、等待I/O操作等),它会保存当前线程的状态(如寄存器值和程序计数器值),并加载另一个线程的状态3。 这个过程称为上下文切换,它涉及到用户态和内核态之间的切换,因此可能会消耗一定的处理器时间3。 同步与互斥:
Java提供了自己的同步机制(如synchronized关键字和java.util.concurrent包中的高级同步结构),但这些机制在底层通常是由操作系统的线程同步机制实现的4。 例如,Java中的锁(如ReentrantLock)在底层可能使用操作系统的互斥量(Mutex)来实现。 总结 因此,可以说JVM中的线程并不是完全由JVM管理的,而是与操作系统线程紧密相关。JVM依赖于操作系统提供的线程管理机制来实现Java线程的创建、销毁、调度和同步等操作。这种关系使得Java程序能够充分利用操作系统的多线程特性,同时也带来了与操作系统交互的开销。
需要注意的是,虽然JVM和操作系统之间的交互是不可避免的,但JVM通过其高级抽象和优化机制(如JIT编译、垃圾回收等)为Java程序提供了跨平台的一致性和高性能。因此,在编写Java程序时,开发者通常不需要关心底层操作系统线程的具体实现细节。
线程阻塞 当Java线程执行到某个阻塞点时(如执行了阻塞的I/O操作、调用了线程的sleep方法、等待某个条件变量的满足等),JVM会向操作系统发出请求,将当前线程的状态从运行状态(RUNNABLE)切换到阻塞状态(BLOCKED或WAITING等)。这个过程中,JVM会调用操作系统的API来实现线程的阻塞。
操作系统层面:在操作系统层面,线程的状态变化是通过修改线程的状态标志(如Linux中的task_struct结构体中的状态字段)来实现的。当线程进入阻塞状态时,操作系统会将其从运行队列中移除,并可能将其添加到等待队列中(对于需要等待某个事件或资源的线程)。此时,线程将不再参与CPU的调度,直到被唤醒1。
内核态与用户态切换:线程的阻塞和唤醒过程通常涉及用户态和内核态之间的切换。用户态是用户程序运行的环境,而内核态是操作系统内核运行的环境。当线程需要执行阻塞操作时,JVM会发起系统调用(如Linux中的read系统调用),这会导致CPU从用户态切换到内核态,执行相应的内核代码来处理阻塞请求。内核代码会使用当前进程的内核栈来保存上下文信息,并在处理完成后将CPU切换回用户态2。
线程唤醒 当线程被唤醒时(如等待的I/O操作完成、调用了线程的interrupt方法、其他线程调用了notify/notifyAll方法等),操作系统会接收到相应的通知,并将线程从等待队列中移除,重新添加到运行队列中。此时,线程将有机会再次参与CPU的调度,并执行其后续任务。
唤醒机制:唤醒机制通常依赖于操作系统的中断机制和事件通知机制。例如,在Linux中,当硬件中断发生时(如I/O操作完成),中断处理程序会执行相应的中断服务例程,并通过回调函数或信号量等方式通知等待的线程。线程被唤醒后,其task_struct结构体中的状态字段会被修改为TASK_RUNNING,并重新参与CPU的调度1。
性能影响:线程的阻塞和唤醒操作会消耗一定的系统资源,包括CPU时间和内存空间。特别是当线程频繁地进行阻塞和唤醒操作时,这种开销会更加明显。因此,在编写多线程程序时,需要合理设计线程之间的同步和通信机制,以减少不必要的阻塞和唤醒操作,提高程序的性能和响应速度
# Execution Engine 执行引擎
执行引擎组件:
├── 解释器(Interpreter)
│   ├── 字节码分派器(Bytecode Dispatcher)
│   ├── 运行时助手(Runtime Helpers)
│   └── 栈帧管理器(Stack Frame Manager)
│
├── JIT编译器(Just-In-Time Compiler)
│   ├── 中间表示生成(IR Generation)
│   ├── 优化器(Optimizer)
│   └── 代码生成器(Code Generator)
│
├── 代码缓存(Code Cache)
│   └── 编译后机器码存储区
│
└── 分析器(Profiler)
    ├── 方法调用计数器
    └── 循环回边计数器
解释器 Interpreter:
误解:字节码经过JVM(解释器)的处理后生成电脑可以直接执行的机器码, 实际情况:解释器本身就是C++代码,直接执行字节码对应的操作, 关键点:解释器不是"翻译",而是一个大switch-case,每个字节码对应一段直接执行的C++代码。
// JVM解释器的真实工作方式(C++代码)
void Interpreter::execute() {
    while (true) {
        // 1. 从PC指向的地址取指令
        byte opcode = fetch_byte(pc);

        // 2. 根据操作码直接执行对应的C++代码
        switch (opcode) {
            case IADD: {  // iadd指令
                int b = pop_operand_stack();
                int a = pop_operand_stack();
                push_operand_stack(a + b);  // 直接执行加法操作
                pc += 1;
                break;
            }
            case NEW: {   // new指令
                int class_index = fetch_u2(pc + 1);
                Object* obj = heap_allocate(get_class(class_index));
                push_operand_stack(obj);     // 直接分配对象
                pc += 3;
                break;
            }
            // ... 其他200多个指令的处理
        }
    }
}
Tips:
工具hsdis打印汇编指令;
反过来:
javap java.class 可以把汇编指令/机器码反编译成jvm指令/字节码指令;
The Java Virtual Machine Instruction Set (opens new window)
# Runtime Data Area 内存模型
# 方法区 / 元空间
jdk8之前 永久栈 jdk8之后 元空间
常量 静态变量 类元信息
注意:堆里面的对象实例instance的头部object head里面都有一个class pointer指针指向方法区的类元
# 栈(线程栈)
方法区存的是"菜谱",栈帧是"做菜时用的案板和调料"。
程序计数器(多线程挂起再恢复后知道从哪里开始继续执行)
线程栈:栈帧的先进先出(异步方法呢?) 栈帧:对应每个线程中调用的方法,相应概念: 局部变量表 操作数栈 动态链接 方法出口 本地方法 native method
# PC register JVM程序计数器 VS OS程序计数器
硬件层面:
每个CPU核心只有一个PC寄存器(硬件寄存器)
操作系统通过线程调度让PC在不同线程间切换

JVM软件层面:
每个Java线程有自己的"逻辑PC",存储在线程控制块中:
┌─────────────────┬──────────────────────┐
│  主线程控制块   │  工作线程控制块       │
├─────────────────┼──────────────────────┤
│ 逻辑PC: 0x7000  │ 逻辑PC: 0x6000       │
│ 栈指针: 0x7FF0  │ 栈指针: 0x7EF0       │
│ 状态: RUNNABLE  │ 状态: WAITING        │
└─────────────────┴──────────────────────┘

操作系统调度时:
CPU实际PC寄存器在不同线程的逻辑PC间切换
一. 介绍 JVM程序计数器:
程序计数器是一块较小的内存空间,它的作用可以看作是当前线程所执行的字节码的行号指示器。在虚拟机的概念模型里字节码解释器工作时就是通过改变这个计数器的值来选取下一条需要执行的字节码指令,分支、循环、跳转、异常处理、线程恢复等基础功能都需要依赖这个计数器来完成。- - 摘自《深入理解Java虚拟机》
pc 寄存器又称:程序计数器,指的是:当前线程正在执行的字节码指令地址(行号),简单的说指的是当前线程执行到了哪一行,任意时刻,一个线程只会执行一个方法,pc 寄存器保存一个指向当前线程正在执行的语句的指针。程序运行时,字节码解释器通过改变 pc 寄存器里面的值,达到选取下一条要执行的字节码指令地址的目的。个人理解是,pc 寄存器存储当前正在执行的指令的字节码地址,当该指令结束,字节码解释器会根据pc寄存器里的值选取下一条指令并修改pc寄存器里面的值,达到执行下一条指令的目的。 字节码解释器可以拿到所有的字节码指令执行顺序,而程序计数器只是为了记录当前执行的字节码指令地址,防止线程切换找不到下一条指令地址。
OS程序计数器: 为了保证程序(在操作系统中理解为进程)能够连续地执行下去,CPU必须具有某些手段来确定下一条指令的地址。而程序计数器正是起到这种作用,所以通常又称为指令计数器。在程序开始执行前,必须将它的起始地址,即程序的一条指令所在的内存单元地址送入PC,因此程序计数器(PC)的内容即是从内存提取的第一条指令的地址。当执行指令时,CPU将自动修改PC的内容,即每执行一条指令PC增加一个量,这个量等于指令所含的字节数,以便使其保持的总是将要执行的下一条指令的地址。由于大多数指令都是按顺序来执行的,所以修改的过程通常只是简单的对PC加1。 当程序转移时,转移指令执行的最终结果就是要改变PC的值,此PC值就是转去的地址,以此实现转移。有些机器中也称PC为指令指针IP(Instruction Pointer)
二. 特点 JVM程序计数器:
如果线程正在执行的是Java 方法,则这个计数器记录的是正在执行的虚拟机字节码指令地址
如果正在执行的是Native 方法,则这个技术器值为空(Undefined)
此内存区域是唯一一个在Java虚拟机规范中没有规定任何OutOfMemoryError情况的区域
在任何一个确定的时刻,一个处理器(对于多核处理器来说是一个内核)只会执行一条线程中的指令。因此,为了线程切换后能恢复到正确的执行位置,每条线程都需要有一个独立的程序计数器,各条线程之间的计数器互不影响,独立存储,我们称这类内存区域为“线程私有”的内存
OS程序计数器:
PC永远指向下一条待执行指令的内存地址(永远不会为Undefined),并且在程序开始执行前,将程序指令序列的起始地址,即程序的第一条指令所在的内存单元地址送入PC, CPU按照PC的指示从内存读取第一条指令(取指)。
当执行指令时,CPU自动地修改PC的内容,即每执行一条指令PC增加一个量,这个量等于指令所含的字节数(指令字节数),使PC总是指向下一条将要取指的指令地址。
由于大多数指令都是按顺序来执行的,所以修改PC的过程通常只是简单的对PC 加“指令字节数”。 当程序转移时,转移指令执行的最终结果就是要改变PC的值,此PC值就是转去的目标地址。 处理器总是按照PC指向,取指、译码、执行,以此实现了程序转移。
三.存储位置 JVM程序技术器:
线程独立的,JVM内存模型一块独立的存储区域,一般是CPU高速缓存中(L1~L3)
OS程序计数器:
OS线程的PC寄存器中。
# 堆heap
对象组成: 对象头 object head 分代年龄 class pointer 实例数据 对齐填充
Heap memory = The younger generation + The old generation + Forever The younger generation = Eden District + Two Survivor District (From and To)
ps_survivor_space https://stackoverflow.com/questions/14436183/ps-survivor-space-almost-full
字节码引擎后在后台线程执行垃圾收集(minor gc和full gc),当发生垃圾收集的时候,会stop the world暂停当前活跃的线程
gc root
object header 分代年龄
minor gc: 对象new除了后先放到新生代,满了后触发minor gc,挪到from(survivor0),后面就在from(survivor0) to(survivor1)之间周转,直到被回收,或者直到年龄到达15,被挪到老生代
老生代包含: 1.长生不死的对象 (比如web服务的bean对象,线程池对象等) 2.大对象 3.动态年龄判断
full gc:老年代满了会触发
jdk调优工具jvisualvm (插件 visualgc)
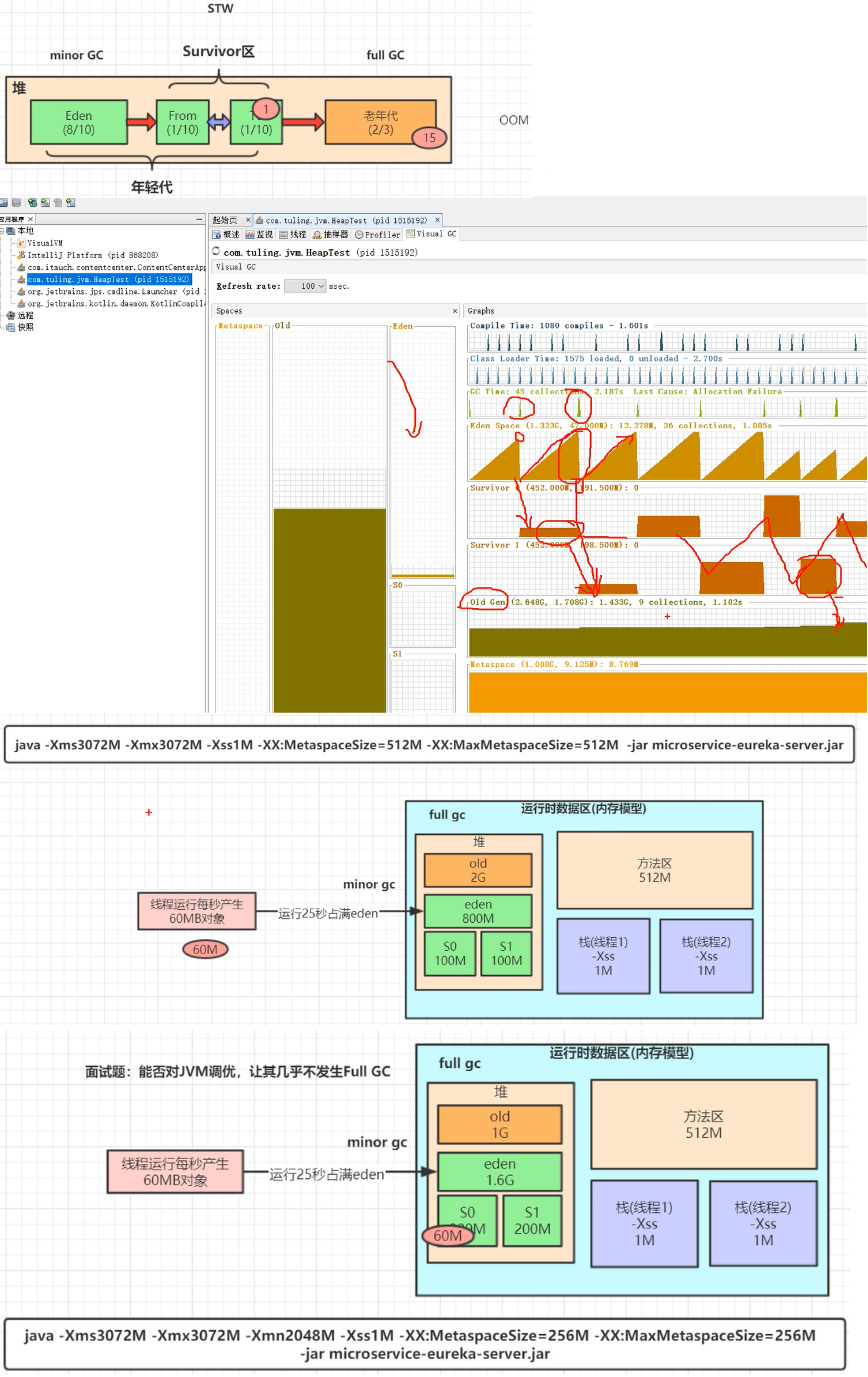
图中下部分给出了调优的例子
jmap -heap <pid>
print result:
using thread-local object allocation.
Parallel GC with 8 thread(s)

Heap Configuration:
   MinHeapFreeRatio         = 0
   MaxHeapFreeRatio         = 100
   MaxHeapSize              = 5221908480 (4980.0MB)
   NewSize                  = 109051904 (104.0MB)
   MaxNewSize               = 1740636160 (1660.0MB)
   OldSize                  = 218103808 (208.0MB)
   NewRatio                 = 2
   SurvivorRatio            = 8
   MetaspaceSize            = 21807104 (20.796875MB)
   CompressedClassSpaceSize = 1073741824 (1024.0MB)
   MaxMetaspaceSize         = 17592186044415 MB
   G1HeapRegionSize         = 0 (0.0MB)

Heap Usage:
PS Young Generation
Eden Space:
   capacity = 967835648 (923.0MB)
   used     = 368550864 (351.4774932861328MB)
   free     = 599284784 (571.5225067138672MB)
   38.079901764478095% used
From Space:
   capacity = 2097152 (2.0MB)
   used     = 0 (0.0MB)
   free     = 2097152 (2.0MB)
   0.0% used
To Space:
   capacity = 20447232 (19.5MB)
   used     = 0 (0.0MB)
   free     = 20447232 (19.5MB)
   0.0% used
PS Old Generation
   capacity = 207618048 (198.0MB)
   used     = 22015016 (20.995155334472656MB)
   free     = 185603032 (177.00484466552734MB)
   10.60361380528922% used

21451 interned Strings occupying 2317096 bytes.


XX:SurvivorRatio
https://blog.csdn.net/flyfhj/article/details/86630105
# Native Method Area
本地方法: Native method Stack,比如JNI调用c/C++程序
# 内存模型
JVM 进程 RES = 堆(-Xmx)
- 元空间
- 线程栈(线程数 × -Xss)
- 直接内存
- JIT 代码缓存
- JVM 自身开销
- glibc 内存碎片
假设: -Xmx8g 线程数 400 -Xss1m 元空间 512m 直接内存 1g
≈ 8g (heap)
- 0.4g (stack)
- 0.5g (metaspace)
- 1g (direct)
- ~0.5g (JVM + code cache) = ~10.5g
# JMM
Linux的内存空间地址从低到高一般分为五个部分:内核空间、栈区域、堆区域、BBS段、数据段和代码段
内核空间:我们在编写应用程序(非内核空间程序)的时候,这一块地址我们是不能够使用的 栈区域:程序中局部变量、函数参数、返回地址的地方地址。地址从低到高分配 堆区域:由malloc,calloc等创建的空间,是运行的时候由程序申请的。地址由高到低 BBS段:未初始化或初值为0的全局变量和静态局部变量 数据段:已初始化且初值非0的全局变量和静态局部变量 代码段:可执行代码、字符串字面值、只读变量
从抽象的角度来看,JMM定义了线程和主内存之间的抽象关系:线程之间的共享变量存储在主内存(main memory)中,每个线程都有一个私有的本地内存(local memory),本地内存中存储了该线程以读/写共享变量的副本。 本地内存是JMM的一个抽象概念,它涵盖了各种CPU缓存、寄存器以及其他的硬件和编译器优化。
openJDK, IBM JDK, 阿里巴巴内部定制JVM
Java 内存模型对主内存与工作内存之间的具体交互协议定义了八种操作,具体如下:
- lock(锁定):作用于主内存变量,把一个变量标识为一条线程独占状态。
- unlock(解锁):作用于主内存变量,把一个处于锁定状态的变量释放出来,释放后的变量才可以被其他线程锁定。
- read(读取):作用于主内存变量,把一个变量从主内存传输到线程的工作内存中,以便随后的 load 动作使用。
- load(载入):作用于工作内存变量,把 read 操作从主内存中得到的变量值放入工作内存的变量副本中。
- use(使用):作用于工作内存变量,把工作内存中的一个变量值传递给执行引擎,每当虚拟机遇到一个需要使用变量值的字节码指令时执行此操作。
- assign(赋值):作用于工作内存变量,把一个从执行引擎接收的值赋值给工作内存的变量,每当虚拟机遇到一个需要给变量进行赋值的字节码指令时执行此操作。
- store(存储):作用于工作内存变量,把工作内存中一个变量的值传递到主内存中,以便后续 write 操作。
- write(写入):作用于主内存变量,把 store 操作从工作内存中得到的值放入主内存变量中。
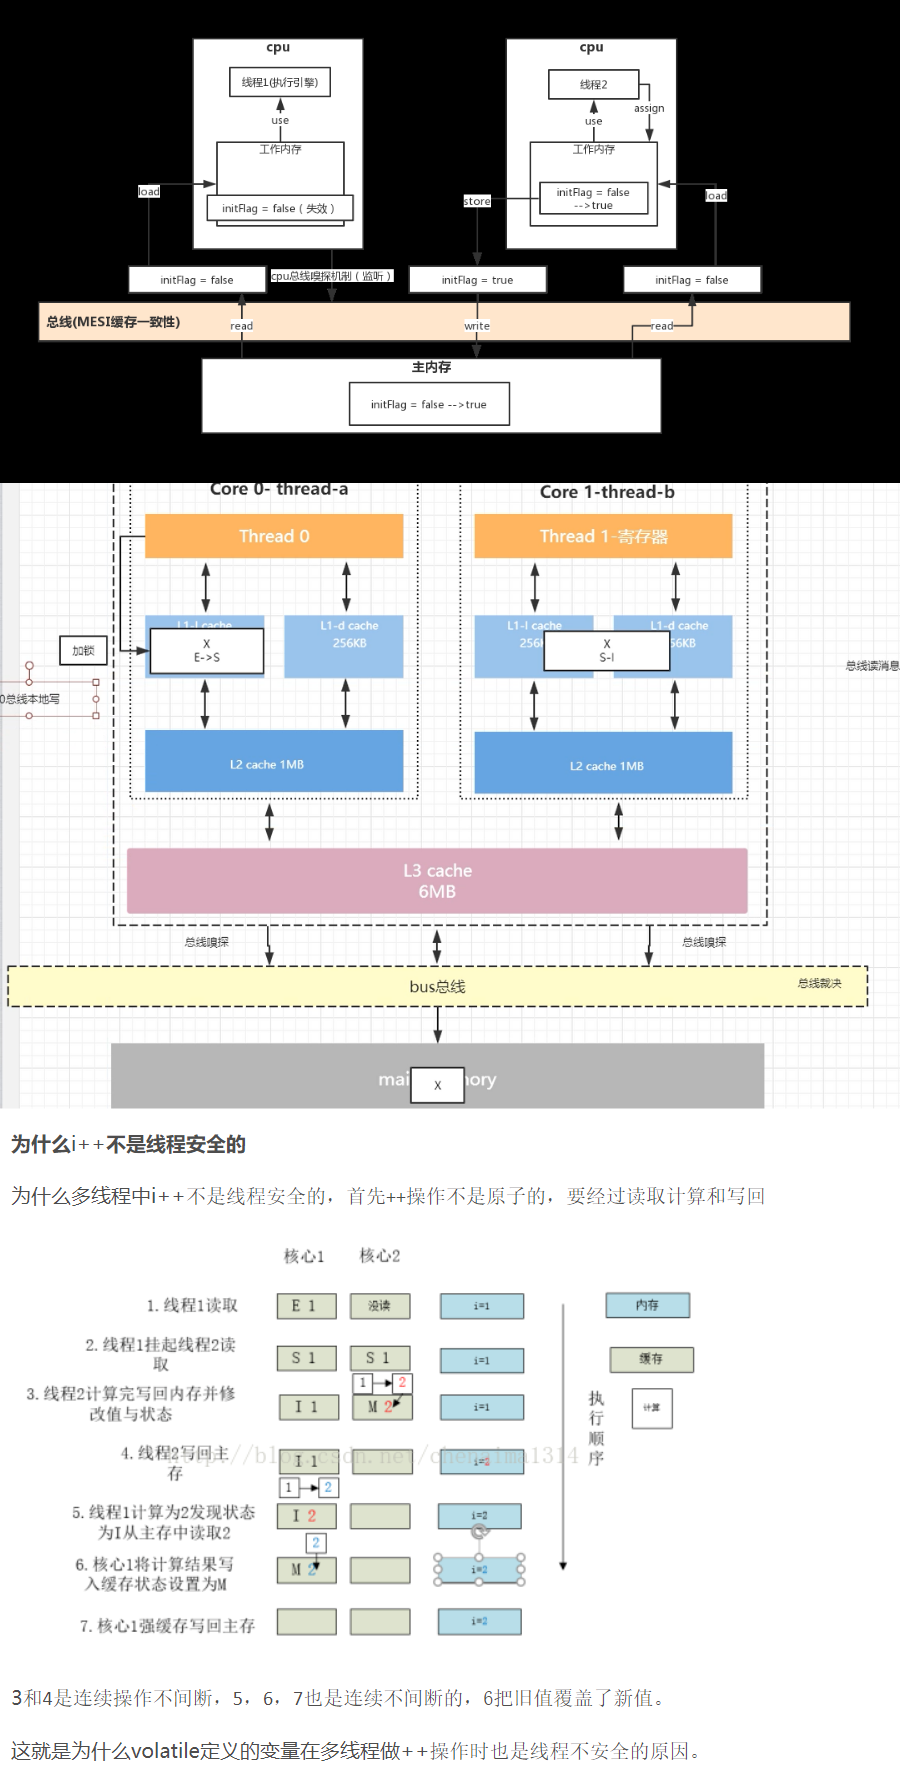
默认如图采用缓存一致性:MESI一致性协议 总线消息;总线嗅探;总线裁决; 指令重排 https://efectivejava.blogspot.com/2013/07/what-is-reordering-in-java-when-you.html
总线锁,如果是跨多个缓存行则采取总线锁
volatile避免指令重排,图下部分可见,volatile并不能保证线程安全(线程1最终并非基于线程2的最新结果2加1,而是基于旧的值1计算,虽然知道线程2修改的结果,但是它的做法是直接覆盖!)
入门到放弃 https://juejin.im/post/5b45ef49f265da0f5140489c
JMX Monitor https://docs.oracle.com/javase/6/docs/technotes/guides/management/agent.html
JPDA https://zhuanlan.zhihu.com/p/59639046
Load jni library from jar: https://blog.csdn.net/Revivedsun/article/details/86562934 https://stackoverflow.com/questions/1611357/how-to-make-a-jar-file-that-includes-dll-files http://www.jdotsoft.com/JarClassLoader.php#tempfiles
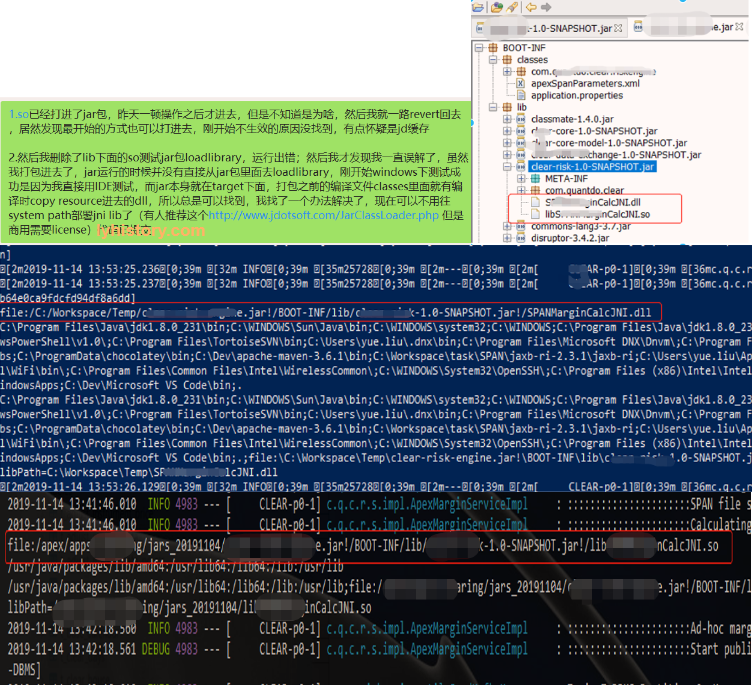
file:/C:/Workspace/Temp/XXX.jar!/BOOT-INF/lib/XXX-1.0-SNAPSHOT.jar!/XXXJNI.dll
file:/opt/XXX.jar!/BOOT-INF/lib/XXX-1.0-SNAPSHOT.jar!/libXXXJNI.so
getClass().getResourceAsStream("/filename"); https://stackoverflow.com/questions/20389255/reading-a-resource-file-from-within-jar
# GC
https://www.baeldung.com/java-verbose-gc#/ https://juejin.cn/post/6999865723145158670#/ https://www.baeldung.com/jvm-garbage-collectors#/
# The Serial Collector(Stop-the-world)
The serial collector is the simplest one, and the one you probably won’t be using, as it’s mainly designed for single-threaded environments (e.g. 32 bit or Windows) and for small heaps. This collector freezes all application threads whenever it’s working, which disqualifies it for all intents and purposes from being used in a server environment.
How to use it: You can use it by turning on the -XX:+UseSerialGC JVM argument
# The Parallel/Throughput Collector
Next off is the Parallel collector. This is the JVM’s default collector. Much like its name, its biggest advantage is that is uses multiple threads to scan through and compact the heap. The downside to the parallel collector is that it will stop application threads when performing either a minor or full GC collection. The parallel collector is best suited for apps that can tolerate application pauses and are trying to optimize for lower CPU overhead caused by the collector.
# The CMS Collector
问题太多已经废弃 Following up on the parallel collector is the CMS collector (“concurrent-mark-sweep”). This algorithm uses multiple threads (“concurrent”) to scan through the heap (“mark”) for unused objects that can be recycled (“sweep”). This algorithm will enter “stop the world” (STW) mode in two cases: when initializing the initial marking of roots (objects in the old generation that are reachable from thread entry points or static variables) and when the application has changed the state of the heap while the algorithm was running concurrently, forcing it to go back and do some final touches to make sure it has the right objects marked.
The biggest concern when using this collector is encountering promotion failures which are instances where a race condition occurs between collecting the young and old generations. If the collector needs to promote young objects to the old generation, but hasn’t had enough time to make space clear it, it will have to do so first which will result in a full STW collection – the very thing this CMS collector was meant to prevent. To make sure this doesn’t happen you would either increase the size of the old generation (or the entire heap for that matter) or allocate more background threads to the collector for him to compete with the rate of object allocation.
Another downside to this algorithm in comparison to the parallel collector is that it uses more CPU in order to provide the application with higher levels of continuous throughput, by using multiple threads to perform scanning and collection. For most long-running server applications which are adverse to application freezes, that’s usually a good trade off to make. Even so, this algorithm is not on by default. You have to specify XX:+USeParNewGC to actually enable it. If you’re willing to allocate more CPU resources to avoid application pauses this is the collector you’ll probably want to use, assuming that your heap is less than 4Gb in size. However, if it’s greater than 4GB, you’ll probably want to use the last algorithm – the G1 Collector.
# The G1 Collector
大内存选G1
G1收集器对分代模型进行了革新。它不再要求物理上连续的新生代和老年代空间,而是将堆划分为多个固定大小的Region。
逻辑分代:G1仍然有新生代和老年代的概念。一部分Region被指定为Eden区,一部分为Survivor区,另一部分为Old区。但这些Region不需要在物理上连续。
分区回收:G1的回收不再针对整个新生代或老年代,而是优先回收那些垃圾最多(Garbage-First) 的Region,无论它属于哪个代。这种基于Region的回收机制是其实现可预测停顿时间的核心。
算法优势:在回收Region时,G1会将存活对象从一个或多个Region复制(Evacuate)到另一个空闲Region。这个过程同时完成了标记-复制和内存整理,有效避免了内存碎片问题
Garbage-First Garbage Collector (opens new window) Garbage First Garbage Collector Tuning (opens new window)
The Garbage first collector (G1) introduced in JDK 7 update 4 was designed to better support heaps larger than 4GB. The G1 collector utilizes multiple background threads to scan through the heap that it divides into regions, spanning from 1MB to 32MB (depending on the size of your heap). G1 collector is geared towards scanning those regions that contain the most garbage objects first, giving it its name (Garbage first). This collector is turned on using the –XX:+UseG1GC flag.
This strategy reduced the chance of the heap being depleted before background threads have finished scanning for unused objects, in which case the collector will have to stop the application which will result in a STW collection. The G1 also has another advantage that is that it compacts the heap on-the-go, something the CMS collector only does during full STW collections.
Large heaps have been a fairly contentious area over the past few years with many developers moving away from the single JVM per machine model to more micro-service, componentized architectures with multiple JVMs per machine. This has been driven by many factors including the desire to isolate different application parts, simplifying deployment and avoiding the cost which would usually come with reloading application classes into memory (something which has actually been improved in Java 8).
Even so, one of the biggest drivers to do this when it comes to the JVM stems from the desire to avoid those long “stop the world” pauses (which can take many seconds in a large collection) that occur with large heaps. This has also been accelerated by container technologies like Docker that enable you to deploy multiple apps on the same physical machine with relative ease.
# JVM Crash debug
注意:jdk版本要跟工具一致(不过我成功的用oracle jdk的visualvm解析了openjdk的hprof文件)
- 文件类型:
- core dump: core.xxx
- heap dump: pid.hprof
- 常用工具:
- jvisualvm
- jps
- jstat
- jmap
- jstack https://www.jianshu.com/p/c6a04c88900a https://docs.oracle.com/javase/8/docs/technotes/guides/troubleshoot/tooldescr016.html
# Debug Live Process:
# javax.net.debug
tls/ssl: java -jar -Djavax.net.debug=all java -jar -Djavax.net.debug=help
java -XX:ErrorFile=/var/log/java/java_error%p.log If the -XX:ErrorFile=file flag is not specified, the default log file name is hs_err_pid.log, where pid is the PID of the process.
JVM参数 https://stackoverflow.com/questions/43087831/complete-list-of-jvm-options java -XX:+UnlockDiagnosticVMOptions -XX:+UnlockExperimentalVMOptions -XX:+PrintFlagsFinal -XX:+PrintFlagsWithComments -version JVM启动参数大全 https://www.cnblogs.com/qlqwjy/p/8037797.html
java -cp vs java -jar https://stackoverflow.com/questions/11922681/differences-between-java-cp-and-java-jar 基本区别就是,如果jar包,比如springboot的包将依赖都已经打入了META-INF,则用-jar,否则如果需要依赖外部的lib,则需要用cp指定classpath java -server -jar *.jar java程序启动参数-D含义详解 https://www.cnblogs.com/grefr/p/6087955.html
# strace
strace -tt -f -o /tmp/output.log -p {pid}
# Analysis Core dump
core file(core.XXX): In case of a JVM crash, the operating system creates a core dump file which is a memory snapshot of a running process. A core dump is created by the operating system when a fatal or unhandled error like signal or system exception occurs.
版本问题: 如果产品上装了多个JVM环境的化,注意core dump要和JVM的分析的版本一致(比如用的是openjdk还是oracle的) SA环境需要root权限
系统配置: ulimit -c unlimited,
不过对于java来说,jvm本身可能有自己的设置,默认应该就是unlimited,所以可以忽略系统设置,查看配置:
jps
jinfo <PROCESS ID>
cat /proc/<PROCESS ID>/limits
# JSTAT
JVM Statistical monitoring tools
jstat -gc <PID> 250 4 //sampling interval is 250ms,Sampling number for 4

Output:
S0C、S1C、S0U、S1U:Survivor 0/1 Area capacity (Capacity) And usage (Used)
EC、EU:Eden Area capacity and usage
OC、OU: Capacity and usage of older generations
PC、PU: Permanent generation capacity and usage
YGC、YGT: The younger generation GC Times and GC Time consuming
FGC、FGCT:Full GC Times and Full GC Time consuming
GCT:GC Total time
hprof: to show CPU Usage rate , Statistics heap memory usage .
java -agentlib:hprof[=options] ToBeProfiledClass
java -Xrunprof[:options] ToBeProfiledClass
javac -J-agentlib:hprof[=options] ToBeProfiledClass

example:
java -agentlib:hprof=cpu=samples,interval=20,depth=3 Hello

Every other day on the top 20 Millisecond sampling CPU Consumption information , The stack depth is 3, Generated profile File name is java.hprof.txt, In the current directory .
# JSTACK -> Live Process|Core dump
查死锁 jstack -J-d64 -l -m $JAVA_HOME/bin/java core.xxxxx
查内存泄露
top -Hp <PID>
输出结果,TIME一列查看时间占用比较久的 NID
printf "%x" <NID>
jstack <PID>|grep <NID IN hex format>
https://www.cnblogs.com/duanxz/p/5487576.html
# JMAP | JHAT
查内存占用,jhat追查内存泄露 https://programs.wiki/wiki/performance-test-and-analysis-tools-jps-jstack-jmap-jhat-jstat-hprof-use-details.html
jmap $JAVA_HOME/bin/java core.xxxxx
jmap -J-d64
jmap -heap
jmap -histo
jmap + jhat
jmap -dump:format=b,file=core.xxxxx.dump  $JAVA_HOME/bin/java core.xxxxx

jhat -port 9998 core.xxxxx.dump

open in browser: http://XXX:9998
jmap crashes with "can not get class data for" known bug, fixed starting with Java 8 Update 60. https://stackoverflow.com/questions/26882094/jmap-crashes-with-can-not-get-class-data-for
# HSDB -> Live Process|Core dump
Java9为了简化hsdb和clhsdb的使用引入了一个新的命令jhsdb,可以通过该命令直接调用hsdb,clhsdb,jstack, jmap等命令 jhsdb jmap --histo --exe $JAVA_HOME/bin/java --core core.xxxxx
openjdk: GUI: sun.jvm.hotspot.HSDB command: sun.jvm.hotspot.CLHSDB
java -cp .:$JAVA_HOME/lib/sa-jdi.jar sun.jvm.hotspot.CLHSDB
java -cp .:$JAVA_HOME/lib/sa-jdi.jar sun.jvm.hotspot.CLHSDB $JAVA_HOME/bin/java /opt/core.10759
java -cp .:/usr/lib/jvm/java-1.8.0-openjdk-1.8.0.232.b09-0.el7_7.x86_64/lib/sa-jdi.jar sun.jvm.hotspot.CLHSDB /usr/lib/jvm/java-1.8.0-openjdk-1.8.0.232.b09-0.el7_7.x86_64/bin/java /opt/core.10759


输入threads可以查看所有的子线程,输入thread 线程id可以查看该线程的详情
jhisto:trying to print a histogram from the core dump, which shows an unusually high number of instances for Object.
classes是列出已经加载的所有的类的类型信息,class 完整类名是查找该类的类型信息
Inspect,用于查看指定地址的类(C++的类)的各属性信息
jstack用于查看是否存在死锁,查看所有线程的调用栈,加上-v选项可以输出详细的内存地址信息
pstack [-v]
universe同图形界面中的Heap Paramters选项,显示年轻代和老年代堆内存的地址范围
scanoops 用于在指定地址范围内搜索所有指定类型的所有实例(Oop),后跟起始地址和类型信息,然后通过inspect 可查看具体的实例属性
revptrs可根据对象地址查看引用该对象的活跃对象的地址,这里的引用是指通过类全局属性而非局部变量引用,修改上述测试用例在类A中增加一个私有属性,private Base ba=new Base(1);,然后依次执行universe,scanoops,revptrs,inspect命令
mem命令可查看指定起始地址和以位宽为单位的长度的内存的数据,64位CPU的位宽是8字节
print输入一个Klass*, Method*的地址,可以打印该类或者方法,效果等同于Code Viewer选项
where 通过threads可查看所有的线程,输入线程id,查看该线程的调用栈,输入-a,查看所有线程的调用栈
printas 后跟一个Hotspot Type和地址,会打印该Type对象的各属性,效果同inspect命令,不过不局限与oop,也可以是对象的真实地址
printstatics 可以用于获取Hotspot 定义的C++类的静态属性,如表示Java堆内存的Universe对象
printmdo用于打印指定地址的MethodData对象,该对象保存了Profile统计的方法性能的数据

hsdb> threads
.....
30977 main
hsdb> where 30977
Thread 30977 Address: 0x00007fbd80008800

Java Stack Trace for main
Thread state = BLOCKED

hsdb> jhisto

hsdb> help
Available commands:
  assert true | false
  attach pid | exec core
  buildreplayjars [ all | app | boot ]  | [ prefix ]
  class name
  classes
  detach
  dis address [length]
  disassemble address
  dumpcfg { -a | id }
  dumpclass { address | name } [ directory ]
  dumpcodecache
  dumpheap [ file ]
  dumpideal { -a | id }
  dumpilt { -a | id }
  dumpreplaydata { <address > | -a | <thread_id> }
  echo [ true | false ]
  examine [ address/count ] | [ address,address]
  field [ type [ name fieldtype isStatic offset address ] ]
  findpc address
  flags [ flag | -nd ]
  help [ command ]
  history
  inspect expression
  intConstant [ name [ value ] ]
  jdis address
  jhisto
  jseval script
  jsload file
  jstack [-v]
  livenmethods
  longConstant [ name [ value ] ]
  mem address [ length ]
  pmap
  print expression
  printall
  printas type expression
  printmdo [ -a | expression ]
  printstatics [ type ]
  pstack [-v]
  quit
  reattach
  revptrs address
  scanoops start end [ type ]
  search [ heap | perm | rawheap | codecache | threads ] value
  source filename
  symbol address
  symboldump
  symboltable name
  sysprops
  thread { -a | id }
  threads
  tokenize ...
  type [ type [ name super isOop isInteger isUnsigned size ] ]
  universe
  verbose true | false
  versioncheck [ true | false ]
  vmstructsdump
  whatis address
  where { -a | id }
# JDB
https://docs.oracle.com/javase/8/docs/technotes/tools/unix/jdb.html https://stackoverflow.com/questions/20018866/specifying-sourcepath-in-jdb-what-am-i-doing-wrong https://stackoverflow.com/questions/19843096/how-to-debug-a-java-application-without-access-to-the-source-code/58555431#58555431 https://stackoverflow.com/questions/3668379/use-a-jar-with-source-as-source-for-jdb/58603802#58603802
Live:
java -jar -agentlib:jdwp=transport=dt_shmem,address=jdbconn,server=y,suspend=n C:\Workspace\EclipseWorkspace\lyhistory-websocket\lyhistory-websocket.jar
jdb -attach jdbconn
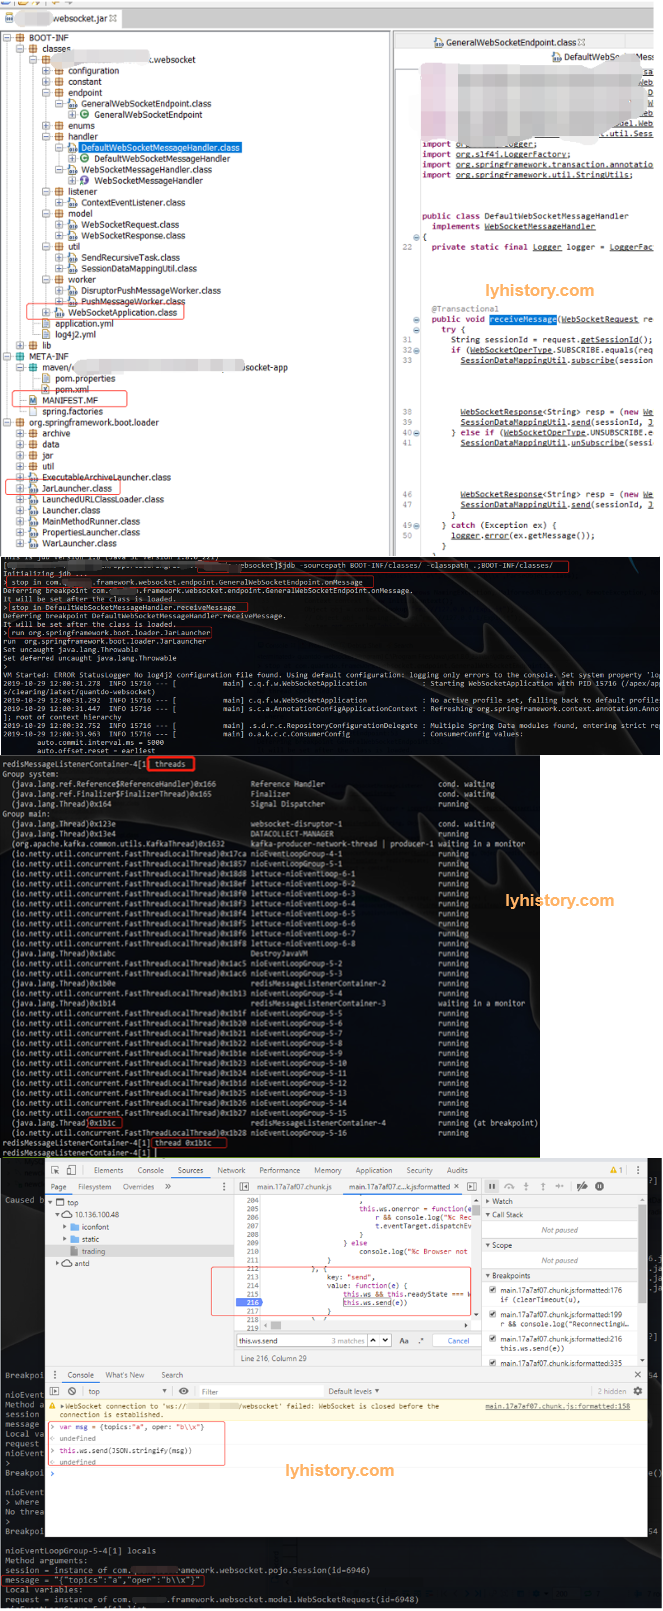
jdb -sourcepath BOOT-INF/classes/ -classpath . org.springframework.boot.loader.JarLauncher
jdb -sourcepath BOOT-INF/classes/ -classpath .;BOOT-INF/classes/
stop at com.lyhistory.framework.websocket.endpoint.GeneralWebSocketEndpoint:54
stop at com.lyhistory.framework.websocket.handler.DefaultWebSocketMessageHandler:32
stop in DefaultWebSocketMessageHandler.receiveMessage
stop in com.lyhistory.framework.websocket.endpoint.GeneralWebSocketEndpoint.onMessage
stop in com.alibaba.fastjson.parser.JSONLexerBase.scanString
public final void scanString() {
public String scanString(char expectNextChar) {
stop at com.alibaba.fastjson.parser.JSONLexerBase:880
run org.springframework.boot.loader.JarLauncher
jdb -sourcepath BOOT-INF/classes/ -classpath .;BOOT-INF/classes/;BOOT-INF/lib/
stop at com.lyhistory.framework.cache.autoconfigure.support.WebsocketMessageListener:35
stop at org.springframework.data.redis.listener.RedisMessageListenerContainer:968
stop at com.lyhistory.framework.websocket.endpoint.GeneralWebSocketEndpoint:54
stop at com.lyhistory.framework.websocket.handler.DefaultWebSocketMessageHandler:32
stop at com.alibaba.fastjson.parser.JSONLexerBase:880
run org.springframework.boot.loader.JarLauncher
** command list **
connectors -- list available connectors and transports in this VM
run [class [args]] -- start execution of application's main class
threads [threadgroup] -- list threads
thread <thread id> -- set default thread
suspend [thread id(s)] -- suspend threads (default: all)
resume [thread id(s)] -- resume threads (default: all)
where [<thread id> | all] -- dump a thread's stack
wherei [<thread id> | all]-- dump a thread's stack, with pc info
up [n frames] -- move up a thread's stack
down [n frames] -- move down a thread's stack
kill <thread id> <expr> -- kill a thread with the given exception object
interrupt <thread id> -- interrupt a thread
print <expr> -- print value of expression
dump <expr> -- print all object information
eval <expr> -- evaluate expression (same as print)
set <lvalue> = <expr> -- assign new value to field/variable/array element
locals -- print all local variables in current stack frame
classes -- list currently known classes
class <class id> -- show details of named class
methods <class id> -- list a class's methods
fields <class id> -- list a class's fields
threadgroups -- list threadgroups
threadgroup <name> -- set current threadgroup
stop in <class id>.<method>[(argument_type,...)]
-- set a breakpoint in a method
stop at <class id>:<line> -- set a breakpoint at a line
clear <class id>.<method>[(argument_type,...)]
-- clear a breakpoint in a method
clear <class id>:<line> -- clear a breakpoint at a line
clear -- list breakpoints
catch [uncaught|caught|all] <class id>|<class pattern>
-- break when specified exception occurs
ignore [uncaught|caught|all] <class id>|<class pattern>
-- cancel 'catch' for the specified exception
watch [access|all] <class id>.<field name>
-- watch access/modifications to a field
unwatch [access|all] <class id>.<field name>
-- discontinue watching access/modifications to a field
trace [go] methods [thread]
-- trace method entries and exits.
-- All threads are suspended unless 'go' is specified
trace [go] method exit | exits [thread]
-- trace the current method's exit, or all methods' exits
-- All threads are suspended unless 'go' is specified
untrace [methods] -- stop tracing method entrys and/or exits
step -- execute current line
step up -- execute until the current method returns to its caller
stepi -- execute current instruction
next -- step one line (step OVER calls)
cont -- continue execution from breakpoint
list [line number|method] -- print source code
use (or sourcepath) [source file path]
-- display or change the source path
exclude [<class pattern>, ... | "none"]
-- do not report step or method events for specified classes
classpath -- print classpath info from target VM
monitor <command> -- execute command each time the program stops
monitor -- list monitors
unmonitor <monitor#> -- delete a monitor
read <filename> -- read and execute a command file
lock <expr> -- print lock info for an object
threadlocks [thread id] -- print lock info for a thread
pop -- pop the stack through and including the current frame
reenter -- same as pop, but current frame is reentered
redefine <class id> <class file name>
-- redefine the code for a class
disablegc <expr> -- prevent garbage collection of an object
enablegc <expr> -- permit garbage collection of an object
!! -- repeat last command
<n> <command> -- repeat command n times
# <command> -- discard (no-op)
help (or ?) -- list commands
version -- print version information
exit (or quit) -- exit debugger
<class id>: a full class name with package qualifiers
<class pattern>: a class name with a leading or trailing wildcard ('*')
<thread id>: thread number as reported in the 'threads' command
<expr>: a Java(TM) Programming Language expression.
Most common syntax is supported.
Startup commands can be placed in either "jdb.ini" or ".jdbrc"
in user.home or user.dir
Core dump:
jdb -connect sun.jvm.hotspot.jdi.SACoreAttachingConnector:javaExecutable=$JAVA_HOME/bin/java,core=core.XXXX
# GDB
https://darkdust.net/files/GDB%20Cheat%20Sheet.pdf
$ export LD_LIBRARY_PATH=/customized/lib
$ gdb --args bin/HelloWorld config/some.xml
<gdb>run


$ gdb $JAVA_HOME/bin/java core.xxxxx
>where
>bt
https://blog.csdn.net/haolipengzhanshen/article/details/106728244?ops_request_misc=%7B%22request_id%22%3A%22165362535516781818746673%22%2C%22scm%22%3A%2220140713.130102334..%22%7D&request_id=165362535516781818746673&biz_id=0&utm_medium=distribute.pc_search_result.none-task-blog-2~all~sobaiduend~default-1-106728244-null-null.142%5Ev11%5Epc_search_result_control_group,157%5Ev12%5Enew_style1&utm_term=free%28%29%3A+invalid+size&spm=1018.2226.3001.4187
# Arthas(阿尔萨斯)
https://github.com/alibaba/arthas https://arthas.aliyun.com/doc/
case study: https://github.com/alibaba/arthas/issues?q=label%3Auser-case
unzip arthas-bin.zip -d arthas
cd arthas
java -jar arthas-boot.jar
>dashboard

java -javaagent:/tmp/test/arthas-agent.jar -jar math-game.jar
./as.sh --select <program name>
# MAT
https://www.eclipse.org/mat/downloads.php
jmap -dump:format=b,file=core.26635.dump $JAVA_HOME/bin/java core.26635
# JVM分层编译机制
JIT编译 (Just-In-Time Compilation)
├── 方法JIT (Method JIT)
│   ├── 触发条件: 方法调用次数达到阈值
│   ├── 编译时机: 方法调用之间
│   └── 执行方式: 下次调用时使用编译版
│
└── OSR编译 (On-Stack Replacement)
    ├── 触发条件: 循环回边次数达到阈值
    ├── 编译时机: 方法执行过程中
    └── 执行方式: 当前执行中热替换
# 解释执行(Tier 0)
// SimpleCalculator.java
public class SimpleCalculator {
    public int add(int a, int b) {
        return a + b;  // 第一次执行:解释执行
    }

    public static void main(String[] args) {
        SimpleCalculator calc = new SimpleCalculator();
        int result = calc.add(5, 3);  // 第1次调用
        System.out.println("结果: " + result);
    }
}
执行过程图示:
第1次调用add方法:
┌─────────────────────────────────┐
│       解释执行 (Tier 0)         │
├─────────────────────────────────┤
│ PC → 方法区: 读取add方法字节码  │
│ ↓                              │
│ 解释器逐条解释执行:            │
│   iload_1 → 加载a=5            │
│   iload_2 → 加载b=3            │
│   iadd    → 执行5+3=8         │
│   ireturn → 返回8             │
│ ↓                              │
│ 方法调用计数器: 0 → 1         │
└─────────────────────────────────┘
# 第二阶段:C1简单编译(Tier 1)
public class SimpleCalculator {
    public static void main(String[] args) {
        SimpleCalculator calc = new SimpleCalculator();

        // 循环调用1500次
        for (int i = 0; i < 1500; i++) {
            calc.add(i, i+1);  // 第1-1500次调用
        }

        // 第1501次调用时触发C1编译!
        calc.add(1500, 1501);
    }
}
编译触发过程:
调用次数监控:
调用第1499次: 计数器=1499 → 继续解释执行
调用第1500次: 计数器=1500 → 触发C1编译!

C1编译过程:
┌─────────────────────────────────┐
│        C1简单编译 (Tier 1)       │
├─────────────────────────────────┤
│ 编译成本: 0.1ms + 占用1KB内存   │
│ 优化级别: 基础优化              │
│ 生成代码: 简单的机器码          │
│ 性能提升: 2倍 (10ms → 5ms)     │
└─────────────────────────────────┘
# 第三阶段:C2深度编译(Tier 2)
触发条件:add方法被调用10000次
public class SimpleCalculator {
    public static void main(String[] args) {
        SimpleCalculator calc = new SimpleCalculator();

        // 循环调用10000次
        for (int i = 0; i < 10000; i++) {
            calc.add(i, i+1);  // 第1-10000次调用
        }

        // 第10001次调用时触发C2编译!
        calc.add(10000, 10001);
    }
}
深度编译过程:
调用第9999次: 计数器=9999 → 执行C1编译的代码
调用第10000次: 计数器=10000 → 触发C2编译!

C2编译过程:
┌─────────────────────────────────┐
│        C2深度编译 (Tier 2)       │
├─────────────────────────────────┤
│ 编译成本: 10ms + 占用100KB内存  │
│ 优化级别: 激进优化              │
│ 生成代码: 高度优化的机器码      │
│ 性能提升: 10倍 (10ms → 1ms)    │
└─────────────────────────────────┘
# 编译成本及性能计算
# 编译成本计算基础
假设的基准数据:
1条字节码指令编译时间 ≈ 0.001ms
1条机器指令占用内存 ≈ 8字节
固定开销(方法头等)≈ 0.05ms + 200字节
add方法成本计算 add方法字节码:
public int add(int a, int b);
  Code:
    0: iload_1    // 加载a
    1: iload_2    // 加载b
    2: iadd       // 相加
    3: ireturn    // 返回
C1编译成本计算:
编译时间 = 固定开销 + 指令数 × 单指令成本
        = 0.05ms + 4条 × 0.001ms/条
        = 0.05ms + 0.004ms
        = 0.054ms ≈ 0.1ms (四舍五入)

内存占用 = 固定开销 + 指令数 × 单指令大小
        = 200字节 + 4条 × 8字节/条
        = 200字节 + 32字节
        = 232字节 ≈ 1KB (按页对齐)
C2编译成本计算:
C2编译有额外优化分析:
- 方法内联分析: +2ms
- 逃逸分析: +3ms
- 寄存器分配优化: +5ms

编译时间 = 基础编译 + 优化分析
        = 0.1ms + (2+3+5)ms
        = 0.1ms + 10ms
        = 10.1ms ≈ 10ms

内存占用 = 基础代码 + 优化数据
        = 1KB + 100KB (优化中间数据)
        = 101KB ≈ 100KB
# 性能基准测试依据
测试环境假设:
CPU:Intel i7-10700K(单核性能基准)
内存:DDR4 3200MHz
测试方法:微基准测试(JMH基准测试框架)
解释执行 vs 编译执行的性能差异 解释执行开销分析:
解释执行add方法的过程:
1. 取指令: 从方法区读取字节码 (10时钟周期)
2. 解码: 解析操作码含义 (5时钟周期)
3. 分派: 跳转到对应处理函数 (15时钟周期)
4. 执行: 执行C++代码实现 (20时钟周期)
5. 更新PC: 指向下条指令 (5时钟周期)

总时钟周期 ≈ 55周期/字节码指令
CPU频率: 4.7GHz = 4.7×10^9周期/秒
每条指令时间 ≈ 55 / 4.7×10^9 ≈ 11.7纳秒
add方法的实际性能计算 add方法字节码分析:
public int add(int a, int b) {
    return a + b;  // 对应4条字节码指令
}
// 字节码序列: iload_1, iload_2, iadd, ireturn
解释执行时间计算:
4条指令 × 11.7纳秒/指令 = 46.8纳秒
加上方法调用开销 ≈ 100纳秒 = 0.1微秒 ≈ 0.0001ms

但实际测试值更大,因为:
- 栈操作开销
- 内存访问延迟
- 分支预测失败
- 缓存未命中

实际微基准测试结果:10ms是夸张的,真实值约0.01ms
教学简化原因:
实际值: 0.0001ms (太小,难以理解)
教学值: 10ms (放大10万倍,便于理解比例关系)

比例关系保持不变:
解释执行 : C1编译 : C2编译 = 10ms : 5ms : 1ms
                  = 100ns : 50ns : 10ns (实际)
                  = 10 : 5 : 1 (比例)
SimpleCalculator的真实性能时间线
真实性能时间线(基于纳秒):
┌──────────────┬─────────────┬─────────────┬─────────────┐
│  调用次数    │   执行方式   │   真实性能   │   教学简化   │
├──────────────┼─────────────┼─────────────┼─────────────┤
│  第1次       │ 解释执行    │ 100纳秒/次  │ "10ms/次"   │
│  第2-1499次  │ 解释执行    │ 100纳秒/次  │ "10ms/次"   │
│  第1500次    │ 触发C1编译  │ 编译耗时100微秒│ "0.1ms编译"│
│  第1501次    │ C1编译执行  │ 50纳秒/次   │ "5ms/次"    │
│  第1502-9999次│ C1编译执行 │ 50纳秒/次   │ "5ms/次"    │
│  第10000次   │ 触发C2编译  │ 编译耗时10ms │ "10ms编译"  │
│  第10001次起 │ C2编译执行  │ 10纳秒/次   │ "1ms/次"    │
└──────────────┴─────────────┴─────────────┴─────────────┘
# SpringBoot应用的实际JIT案例
@SpringBootApplication
public class ECommerceApplication {
    public static void main(String[] args) {
        SpringApplication.run(ECommerceApplication.class, args);
    }
}

@RestController
public class OrderController {
    @Autowired
    private OrderService orderService;

    // 高频API:订单查询
    @GetMapping("/orders/{orderId}")
    public Order getOrder(@PathVariable String orderId) {
        // 触发条件:QPS > 100时,每分钟调用6000次
        // 达到C1编译阈值(1500次)时间:1500/6000 = 0.25分钟
        // 达到C2编译阈值(10000次)时间:10000/6000 = 1.67分钟
        return orderService.findOrderById(orderId);
    }

    // 低频API:订单统计(可能永远不会被编译)
    @GetMapping("/orders/stats")
    public OrderStats getStats() {
        // 每天调用几次,达不到编译阈值
        return orderService.calculateStats();
    }
}

@Service
public class OrderService {
    // 热点业务方法
    public Order findOrderById(String orderId) {
        // 内层循环可能触发OSR编译
        for (int i = 0; i < orderCache.size(); i++) {
            if (orderCache.get(i).getId().equals(orderId)) {
                return orderCache.get(i);
            }
        }
        return database.lookupOrder(orderId);
    }
}
具体的时间触发示例,高频API的JIT时间线:
时间 00:00:00 - 应用启动
时间 00:00:01 - 第一次调用getOrder(),解释执行
时间 00:00:05 - 调用第100次,仍在解释执行
时间 00:00:15 - 调用第1500次,触发C1简单编译
时间 00:01:40 - 调用第10000次,触发C2深度优化
时间 00:10:00 - 调用第10万次,完全优化稳定
# Troubleshooting
| OOM 类型 | 典型原因 | 增大内存是否有效 | 说明 |
|---|---|---|---|
Java heap space | 对象过多、内存泄漏 | ✅ 有效 | 需同步调大 -Xmx |
GC overhead limit exceeded | GC 频繁但回收效果差 | ✅ 有效 | 本质仍是堆不足 |
Metaspace | 类加载过多(热部署/反射/CGLIB) | ✅ 有效 | 需调大 -XX:MaxMetaspaceSize |
Unable to create new native thread | 线程数过多、系统限制 | ❌ 无效 | 通常需减小 -Xss 或限流 |
Direct buffer memory | NIO/Netty 使用过多堆外内存 | ✅ 有效 | 需调大 -XX:MaxDirectMemorySize |
Out of swap space | 系统物理内存 + Swap 耗尽 | ❌ 无效 | 需排查堆外内存泄漏 |
Requested array size exceeds VM limit | 申请超大数组 | ❌ 无效 | 代码逻辑问题 |
Kill process or sacrifice child | Linux OOM Killer 杀进程 | ❌ 视情况 | 需控制 JVM 总内存上限 |
# -XX:MaxMetaspaceSize
A microservice using dynamic class generation (e.g., Spring proxies, ByteBuddy, or Groovy scripts) starts failing after several hours with java.lang.OutOfMemoryError: Metaspace. Why it’s unsolvable without knowing Method Area:
Developers might initially suspect heap issues and increase -Xmx, but the error persists.
Without realizing that each generated class consumes Metaspace, they won’t check class loading leaks.
They may overlook that classes are not unloaded because their class loaders are still referenced (e.g., by a cache).
Only by understanding that Method Area holds class metadata can they diagnose the root cause: excessive class retention.
Consider dynamic class generation frameworks (CGLIB, Byte Buddy, Spring AOP, etc.). For each new proxy or enhanced class:
- New bytecode is generated at runtime.
- A new class is defined via ClassLoader.defineClass().
- Metaspace allocates memory to store:
- The generated .classstructure
- Method tables, vtable, itable
- Constant pools specific to that class
- A Classobject is created in the heap (small footprint). Even if you never instantiate objects of that class, the metadata alone occupies Metaspace. Concrete Example: Spring AOP Proxy Leak
@Service
public class OrderService {
    public void process() { /* ... */ }
}
Spring creates a CGLIB proxy for transaction management. Internally, it generates a class like:
OrderService$$EnhancerBySpringCGLIB$$a3f9c2d1 extends OrderService {
    // Overridden methods with transaction logic
}
If your application repeatedly refreshes contexts or uses custom class loaders without proper cleanup, you get:
- Heap: Many Classobjects (tiny)
- Metaspace: Thousands of identical proxy class definitions (large)
- “Repeatedly Refreshes Contexts” Common real‑world triggers: a) Hot Redeploy in App Servers
Old WebAppClassLoaderstays referenced.
New context loads new proxy classes.
Old classes never unload → Metaspace grows.
b) Spring Boot DevTools Restart
Uses a restart class loader.
Each restart creates fresh proxy classes.
If something holds a reference to the old loader (e.g., static cache), classes leak.
c) Dynamic Multi‑Tenant Apps
for (Tenant tenant : tenants) {
    ApplicationContext ctx = new AnnotationConfigApplicationContext(tenantConfig);
    // creates new proxy classes every time
}
- custom class loaders without proper cleanup
static Map<String, Class<?>> cache = new HashMap<>();

Class<?> proxyClass = generateProxy();
cache.put("key", proxyClass);
Solution:
Profile with tools like jcmd (jcmd <pid> GC.class_histogram | grep CGLIB) VisualVM to see class counts. Fix by:
- Reducing unnecessary dynamic class generation.
- Ensuring proper class loader garbage collection (e.g., clearing caches).
- Setting appropriate -XX:MaxMetaspaceSize.
# Heap & Object Lifecycle
Problem:
A high-throughput trading system shows random NullPointerExceptions in production, but only under peak load. Logs show no obvious race conditions.
Why it’s unsolvable without Heap knowledge:
You assume objects are safely published, but ignore that the JVM can reorder writes due to lack of happens-beforeguarantees. Without understanding heap memory barriers and safe publication patterns, you’ll never realize an object is being accessed before its constructor finishes.
Root cause:
Missing finalfields or improper synchronization allows partially constructed objects to escape.
# Stack Memory & Frame Layout
Problem:
A recursive algorithm crashes with StackOverflowErroron one server but runs fine on another with identical specs.
Why it’s unsolvable without Stack knowledge:
You tune -Xssrandomly without realizing stack frames differ by architecture (x86 vs ARM) and JIT optimizations (e.g., inlining). Without knowing how local variables, operand stacks, and frame slots are allocated, you can’t explain why the same recursion depth behaves differently.
Root cause:
JIT inlining increases stack frame size per call; smaller -Xsson ARM triggers overflow earlier.
# Garbage Collector (GC) Behavior
Problem:
An app experiences multi-second pauses every hour, but heap usage never exceeds 50%.
Why it’s unsolvable without GC knowledge:
You monitor only heap occupancy and miss GC promotion failure. Without understanding generational GC, card tables, and remembered sets, you won’t see that short-lived objects are incorrectly aging into Old Gen, causing expensive Full GCs.
Root cause:
-XX:MaxTenuringThresholdmisconfiguration + survivor space overflow.
# JIT Compilation & Deoptimization
Problem:
A method runs fast for hours, then suddenly slows down 100x without code changes.
Why it’s unsolvable without JIT knowledge:
You don’t know about deoptimization traps. Without understanding profile-guided optimization, uncommon traps, and recompilation thresholds, you’ll never link the slowdown to a rare branch that wasn’t exercised during warmup.
Root cause:
A rarely taken ifpath causes the JIT to discard optimized code and fall back to interpreted mode.
# Class Loading & Initialization
Problem:
A web app fails to start intermittently with NoClassDefFoundErrorfor a class that clearly exists.
Why it’s unsolvable without Class Loading knowledge:
You check classpath and JARs, but ignore static initializer deadlocks. Without understanding parent-first delegation, class initialization phases, and cyclic dependencies, you won’t see two classes deadlocking during
Root cause:
Two classes initialize each other via static fields, causing infinite recursion in class loading.
# Direct Memory (Off-Heap)
Problem:
App crashes with OutOfMemoryErroreven though heap is half empty.
Why it’s unsolvable without Direct Memory knowledge:
You monitor only heap and miss native memory tracking. Without understanding NIO direct buffers, JNI allocations, and MaxDirectMemorySize, you won’t detect that Netty is leaking off-heap memory.
Root cause:
Direct ByteBufferallocations bypass heap limits and exhaust process virtual memory.
refer:
双十一电商网站亿级流量JVM调优实战视频教程全集 (opens new window) 马士兵-JVM核心难点讲解—调优过程:G1垃圾回收器(核心算法+调优实战) (opens new window)