回目录 《Monitor》
Options:
grafna prometheus zabbix netbox
# 1.Basics
# 1.1 Visualization
Data Visualize https://www.elastic.co/
grafana https://grafana.com/docs/features/panels/graph/ X-axis type: time, series, histogram https://grafana.com/docs/features/datasources/ https://grafana.com/docs/features/datasources/prometheus/
Grafana vs kibana https://logz.io/blog/grafana-vs-kibana/ https://grafana.com/docs/features/datasources/elasticsearch/
Grafana with nginx Set up domain Running Grafana behind a reverse proxy http://docs.grafana.org/installation/behind_proxy/
tail -f /var/log/grafana/grafana.log
?#issues Template variables are not supported in alert queries Create new chart/graph without using any template variables /etc/grafana/grafana.ini
?#grafana mail: expected single address, got Resolved by comment out from_name
?#could not send email 1: 452 4.3.1 Out of memory
If you have a lot of messages queued up it could go over the max number of messages per connection. To see if this is the case you can try submitting only a few messages to that domain at a time and then keep increasing the number until you find the maximum number accepted by the server. https://social.msdn.microsoft.com/Forums/sqlserver/en-US/a1821fec-5109-46e0-8b18-36b96646a5c7/failure-sending-mail?forum=sqlreportingservices
grafana permission Add permission, and remember remove all default viewer and editor permission
# 1.2 Data source compare
Elastic / prometheus/ influxdb/ opentsdb /…... https://prometheus.io/docs/introduction/comparison/ event logging and metrics recording
Prometheus vs influxdb InfluxDB supports timestamps with up to nanosecond resolution Prometheus, by contrast, supports the float64 data type with limited support for strings, and millisecond resolution timestamps Where InfluxDB is better: ● If you're doing event logging. ● Commercial option offers clustering for InfluxDB, which is also better for long term data storage. ● Eventually consistent view of data between replicas. Where Prometheus is better: ● If you're primarily doing metrics. ● More powerful query language, alerting, and notification functionality. ● Higher availability and uptime for graphing and alerting.
InfluxDB is maintained by a single commercial company following the open-core model, offering premium features like closed-source clustering, hosting and support. Prometheus is a fully open source and independent project, maintained by a number of companies and individuals, some of whom also offer commercial services and support.
Prometheus vs. OpenTSDB OpenTSDB is a distributed time series database based on Hadoop and HBase.
Prometheus VS Zabbix Zabbix 和 Prometheus 都是流行的开源监控工具,它们各自具有独特的优势。Zabbix 主要用于网络和系统监控,而 Prometheus 则专注于开源的分布式时间序列数据库。在某些场景下,将这两个工具整合在一起可以更好地发挥它们的优势,提高监控的灵活性和效率。 Zabbix 和 Prometheus 到底怎么选? (opens new window) Zabbix 整合 Prometheus (opens new window)
# 1.3 采集器 agent
- telegraf
- node exporter
- Synthetic Monitoring Agent https://github.com/grafana/synthetic-monitoring-agent
# 2. Details
# 2.1 Prometheus
https://prometheus.io/docs/introduction/overview/
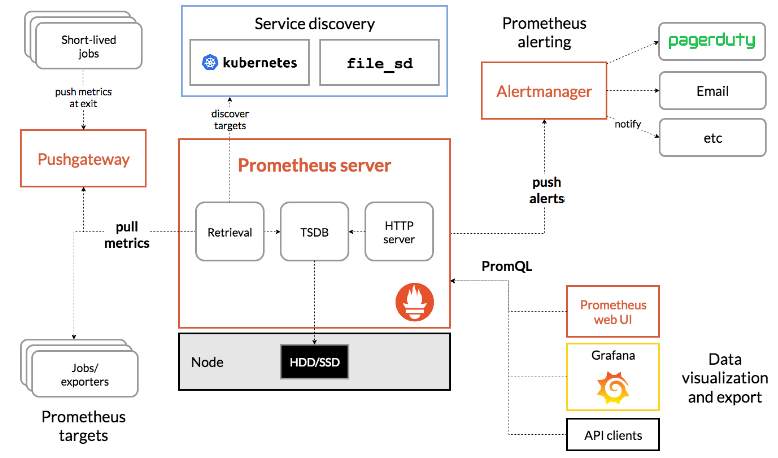
Pull or push? Scrape config: scrape interval Reload config(not work?) https://www.robustperception.io/reloading-prometheus-configuration
Prometheus http://localhost:9090 Monitor your applications with Prometheus https://blog.alexellis.io/prometheus-monitoring/
# 2.1.1 Metric type
https://prometheus.io/docs/concepts/metric_types/ Samples: https://gist.github.com/lyhistory/998448f439594d3eec073d7849d713a8 counter, gauge, histogram, summary Counter increase all the time Gauge can be negative, decrease or increase
Summary vs histogram
Summary直接统计每个百分位的“数值”【客户端计算】,比如0.5即50%的请求相应时间是多少 (全范围统计,over all time):
*****_duration_seconds{quantile="0.5"}
*****_duration_seconds_sum
*****_duration_seconds_count
*****_duration_seconds_sum/*****_duration_seconds_count 每个请求的平均耗时
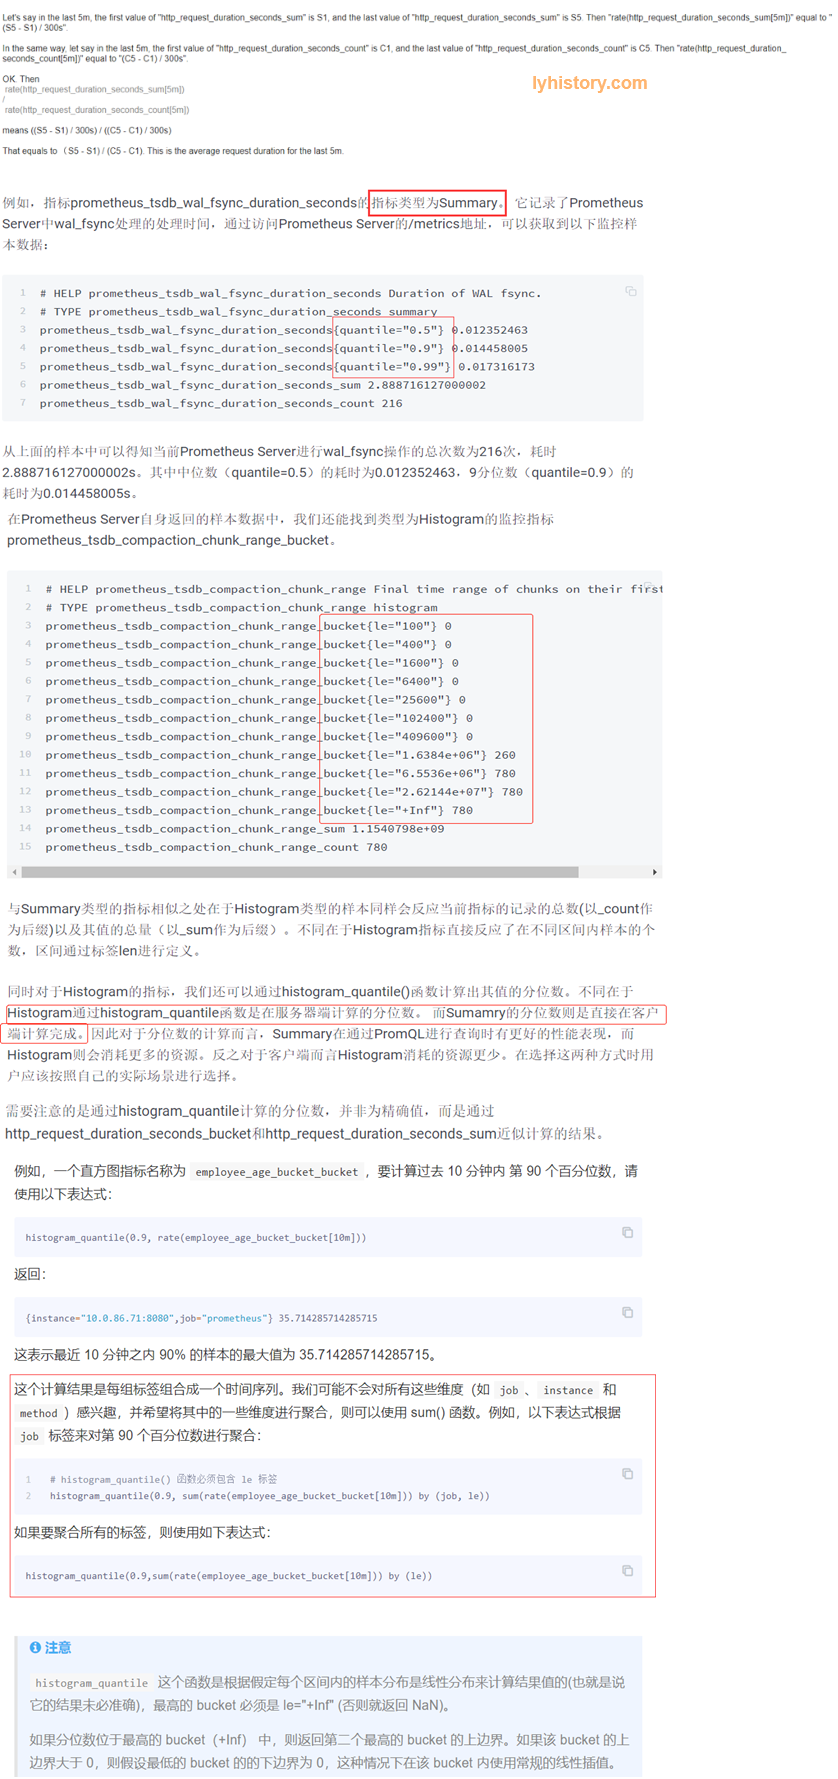
而histogram直接反应了不同区间内样本的个数【服务端计算】(后面的区间是覆盖前面的区间)(全范围统计,over all time)
*****_range_bucket{le="100"} 小于100秒的请求个数有几个
*****_range_sum
*****_range_count
*****_range_sum/*****_range_count 每个请求的耗时
histogram计算百分位函数histogram_quantile
histogram_quantile(0.5, *****_duration_seconds_bucket) 占50%的请求的平均耗时(需要注意的是通过histogram_quantile计算的分位数,并非为精确值,而是通过*****_duration_seconds_bucket和*****_duration_seconds_sum近似计算的结果)
进一步, Over 10m统计:
Summary
rate(*****_duration_seconds_sum[10m]) / rate(*****_duration_seconds_count[10])
Histogram
rate(*****_range_sum[10m]) / rate(*****_range_count[10m])
histogram_quantile(0.5, rate(*****_duration_seconds_bucket[10m])) 这个结果可能因为还有其他label比如responsecode=200/404产生多条记录:过去10分钟,返回200的50%的请求的平均响应时间以及返回404的50%的请求的平均响应时间,如果想获取过去10分钟,返回所有请求之中的50%的请求的平均响应时间,则需要用
histogram_quantile(0.5, sum(rate(*****_duration_seconds_bucket[10m])) by (le))
 https://groups.google.com/forum/#!topic/prometheus-developers/VYaiXJCsHxQ
https://yunlzheng.gitbook.io/prometheus-book/parti-prometheus-ji-chu/promql/prometheus-metrics-types
https://www.yangcs.net/prometheus/3-prometheus/functions.html
https://groups.google.com/forum/#!topic/prometheus-developers/VYaiXJCsHxQ
https://yunlzheng.gitbook.io/prometheus-book/parti-prometheus-ji-chu/promql/prometheus-metrics-types
https://www.yangcs.net/prometheus/3-prometheus/functions.html
Sample - Summary
The Python client doesn't store or expose quantile information at this time request_processing_seconds_sum request_processing_seconds_count rate(request_processing_seconds_sum[25m])/rate(request_processing_seconds_count[25m])
from prometheus_client.core import GaugeMetricFamily, CounterMetricFamily, REGISTRY
from prometheus_client import start_http_server, Summary
import random
import time
# Create a metric to track time spent and requests made.
REQUEST_TIME = Summary('request_processing_seconds', 'Time spent processing request')
# Decorate function with metric.
@REQUEST_TIME.time()
def process_request(t):
   """A dummy function that takes some time."""
   time.sleep(t)
if __name__ == '__main__':
   # Start up the server to expose the metrics.
   parser = argparse.ArgumentParser()
   parser.add_argument('-p', '--port', help="The port the metrics is serving from.", required=True)
   args = parser.parse_args()
   start_http_server(int(args.port))
   #Test Summary
   while True: process_request(random.randint(60,600))
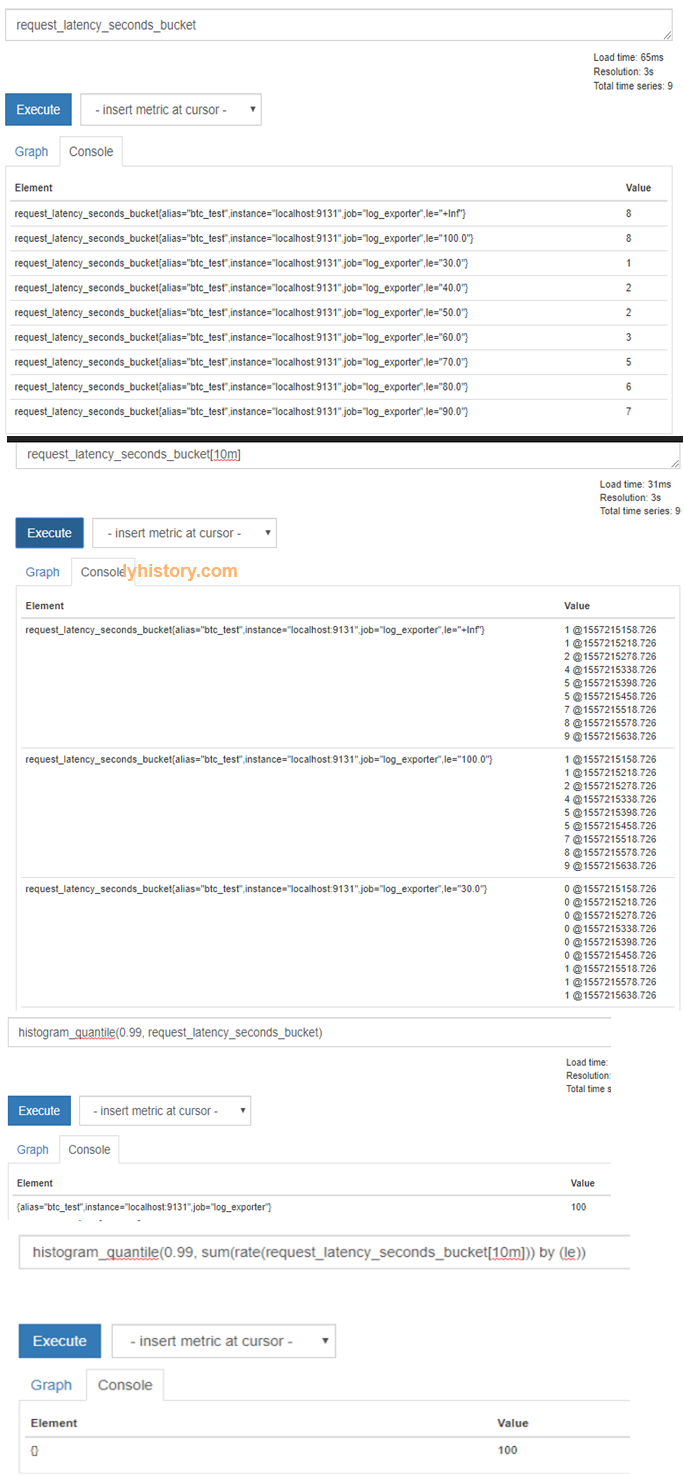
Sample - histogram
request_latency_seconds_bucket
request_latency_seconds_bucket[10m]
histogram_quantile(0.99, request_latency_seconds_bucket)
histogram_quantile(0.99, rate(request_latency_seconds_bucket[10m]))
histogram_quantile(0.99, sum(rate(request_latency_seconds_bucket[10m])) by (le))

##DEFAULT_BUCKETS = (.005, .01, .025, .05, .075, .1, .25, .5, .75, 1.0, 2.5, 5.0, 7.5, 10.0, INF)
INF = float("inf")
# Create a metric to track time spent and requests made.
REQUEST_TIME = Summary('request_processing_seconds', 'Time spent processing request')

# Decorate function with metric.
@REQUEST_TIME.time()
def process_request(t):
	"""A dummy function that takes some time."""
	print(str(t))
	time.sleep(t)
if __name__ == '__main__':
	# Start up the server to expose the metrics.
	parser = argparse.ArgumentParser()
	parser.add_argument('-p', '--port', help="The port the metrics is serving from.", required=True)
	args = parser.parse_args()
	start_http_server(int(args.port))
	#Test Summary
	MY_BUCKETS = (30.0,40.0,50.0,60.0,70.0,80.0,90.0,100.0, INF)
	h = Histogram(name='request_latency_seconds', documentation='Description of histogram',buckets=MY_BUCKETS)
	while True:
    	t = random.randint(20,110)
    	h.observe(t)
    	process_request(t)
Visualize on grafana https://yunlzheng.gitbook.io/prometheus-book/part-ii-prometheus-jin-jie/grafana/grafana-panels/use_graph_panel
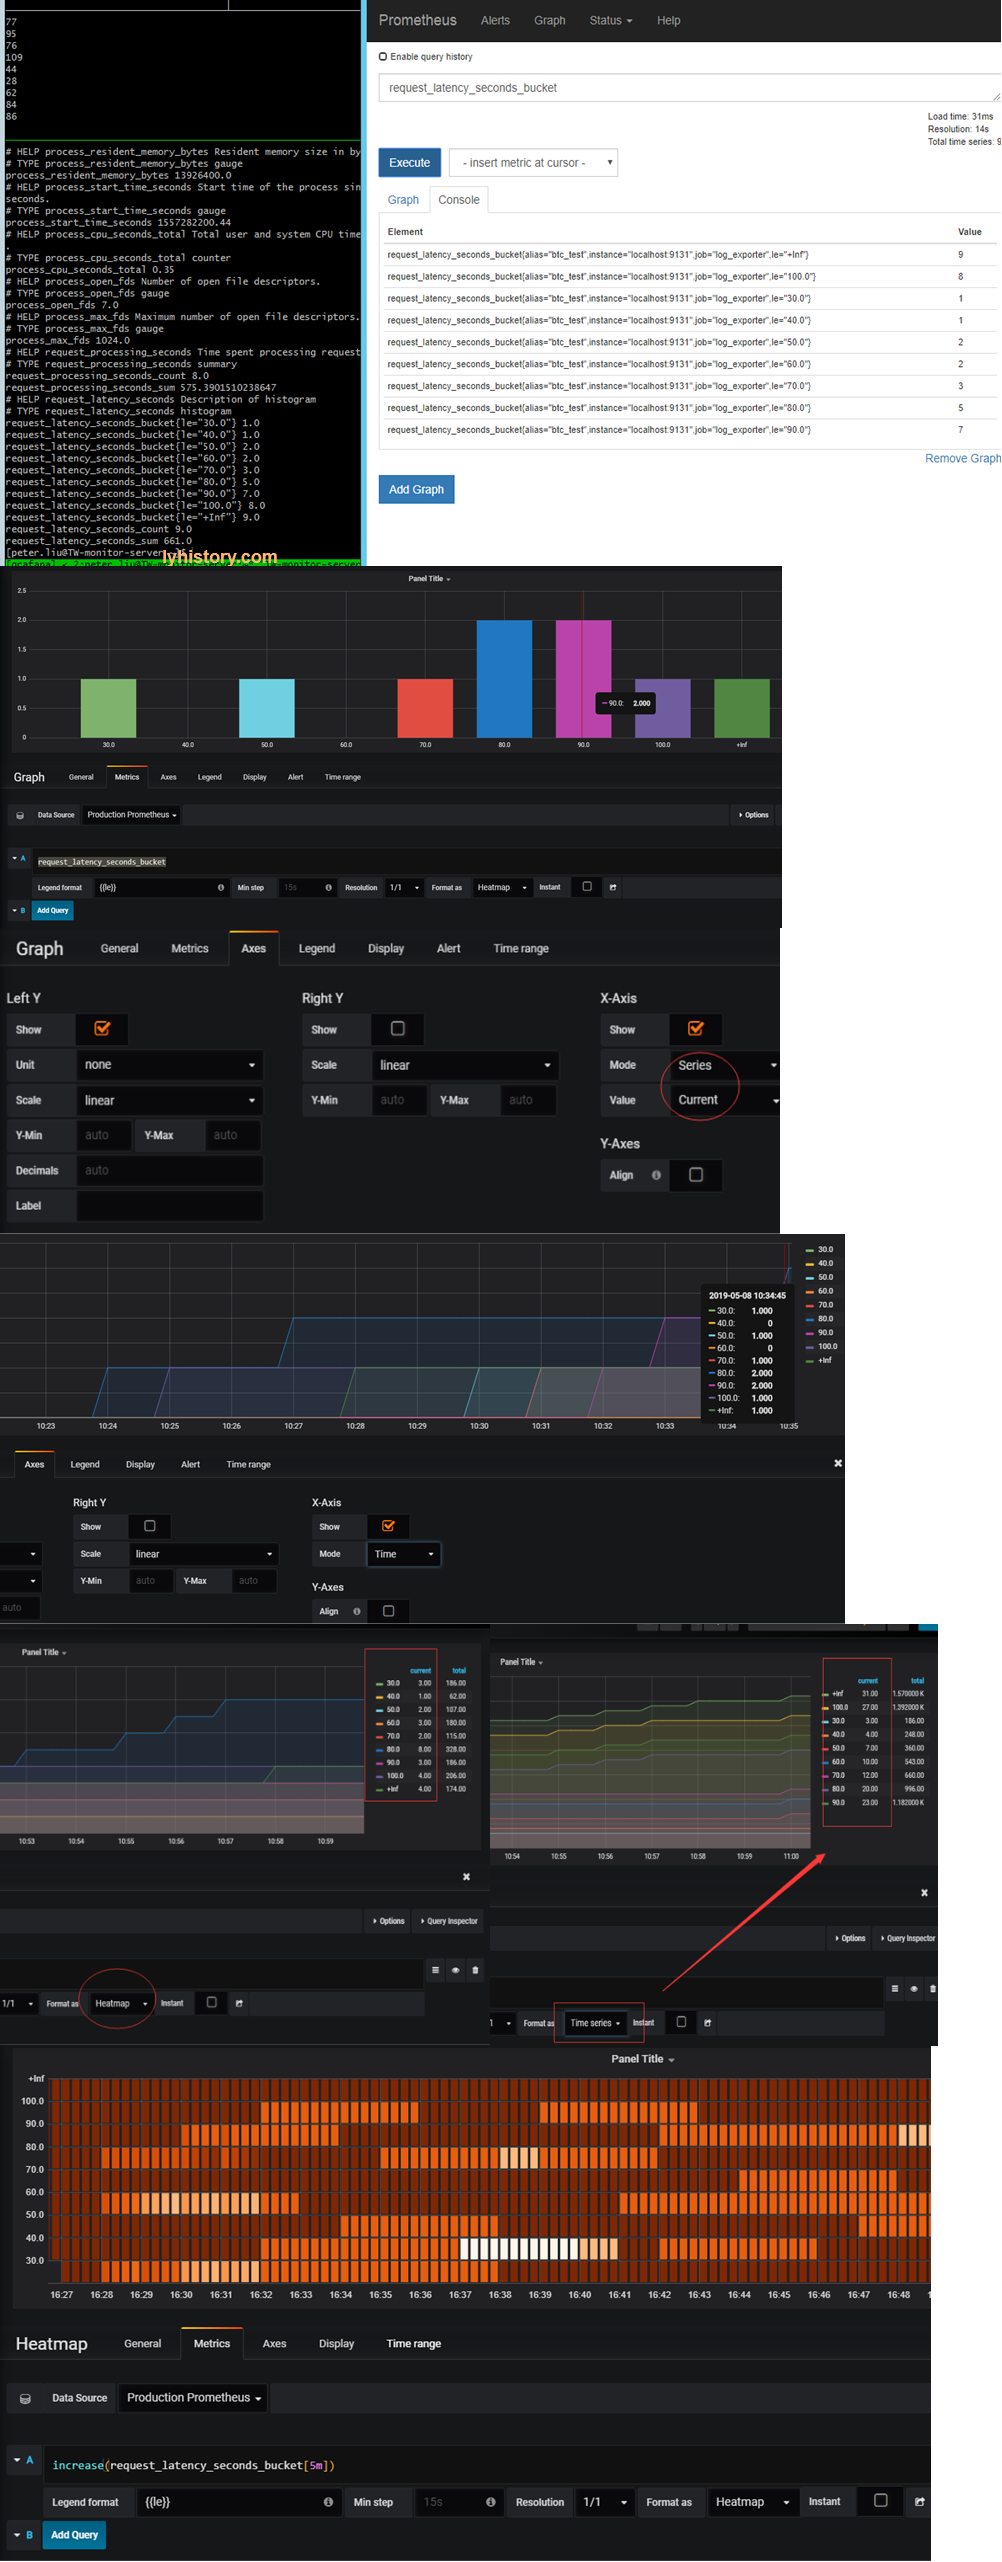
histogram graph: Be careful, grafana x axis ‘histogram’ mode is meaningless for prometheus, so we need to use “Series” mode instead count==****_count[pre-le,le] based on separated buckets Total == ****_count[,le] based on le buckets Demonstrated above with x axis in “Time” Mode
Format as “Heatmap” so that it will separate le buckets into [] individual buckets le[,10] le[,20] …. ====> le[,10] le[10,20] …...
heatmap graph: https://grafana.com/docs/features/panels/heatmap/ Prometheus Histograms & Grafana Heatmaps https://vimeo.com/289620891 Because each **buckets accumulated over time(buckets here has already been separated into individual buckets), so use increase function to show the ‘rate’ along the time
# 2.1.2 Query data type AND PromQL
Literals: String Float/scala Time series selector: Instant vector selector Range vector selector Basic time series https://prometheus.io/docs/prometheus/latest/querying/examples/
Example: scrape every 15s, 4 request every 1m http_requests_total http_requests_total[1m] rate(http_requests_total[1m]) sum(rate(http_requests_total[1m])) by (instance) sum(rate(http_requests_total[1m])) by job) topk(5, sum(rate(http_requests_total[5m])) by (instance))
Histogram and summary https://prometheus.io/docs/practices/histograms/ https://timber.io//blog/promql-for-humans/ https://povilasv.me/prometheus-tracking-request-duration/
# 2.1.3 Metric and Alert sample
Prometheus 监控 Nginx 流量 https://www.cnblogs.com/vovlie/p/Nginx_monitoring.html http://vearne.cc/archives/11085 https://www.cnblogs.com/SleepDragon/p/10642955.html
Exporter EXPORTERS AND INTEGRATIONS https://prometheus.io/docs/instrumenting/exporters/ MONITORING LINUX HOST METRICS WITH THE NODE EXPORTER https://prometheus.io/docs/guides/node-exporter/
Example http://michaeljones.tech/writing-exporters-for-prometheus/ Coinmarketcap: https://blog.billyc.io/2017/12/02/a-prometheus-exporter-for-cryptocurrency-values-using-the-coinmarketcap-api/ https://www.robustperception.io/writing-a-jenkins-exporter-in-python
# 2.1.4 troubleshooting
Prometheus deafult admin dashboard: Status -> Targets : check status
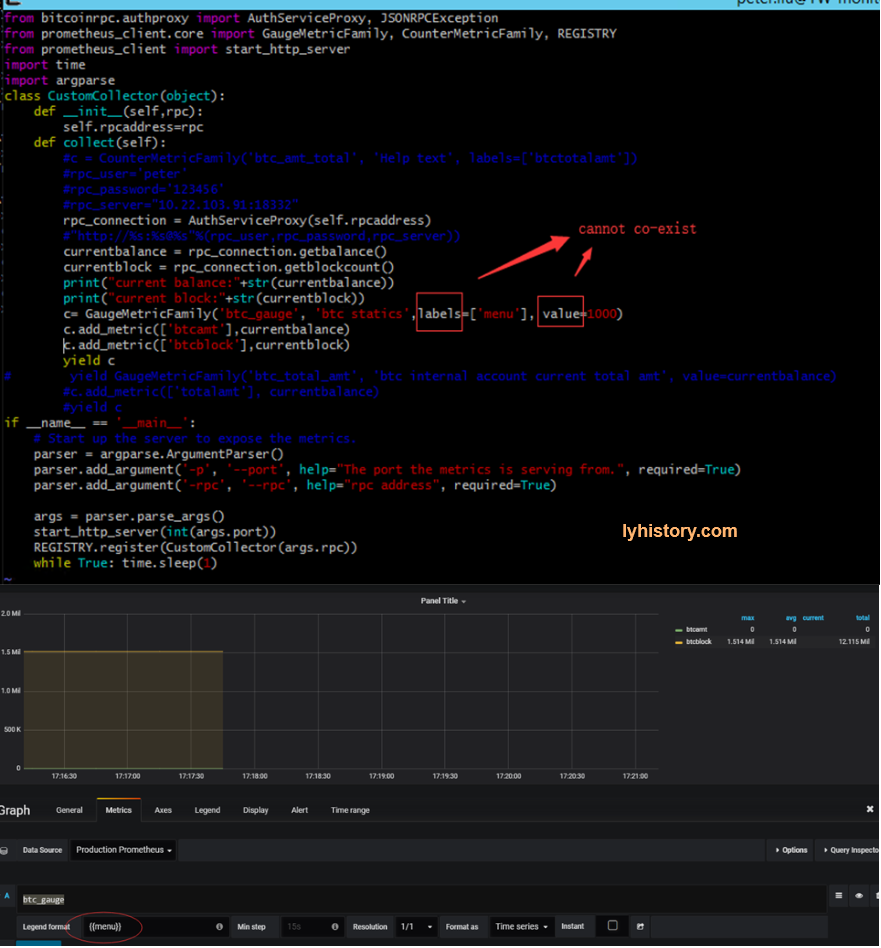
c= GaugeMetricFamily('btc_gauge', 'btc statics',labels=['menu'], value=1000) File "/usr/lib/python2.7/site-packages/prometheus_client/core.py", line 212, in init raise ValueError('Can only specify at most one of value and labels.') ValueError: Can only specify at most one of value and labels.
No token found This usually means that the output is not valid Prometheus text format. Look for hyphens in metric or label names, or either of those starting with numbers - those are the most common errors.
# 2.1.5 More
Scalability
Thanos - a Scalable Prometheus with Unlimited Storage https://www.infoq.com/news/2018/06/thanos-scalable-prometheus
# 2.2 influxdb
# 2.2.1
V1.7 https://docs.influxdata.com/influxdb/v1.7/introduction/getting-started/ https://github.com/influxdata/influxdb-python https://influxdb-python.readthedocs.io/en/latest/api-documentation.html
Change port /etc/influxdb/influxdb.conf Run: influxdb or service start influxdb Cli: influx -precision rfc3339 -host 127.0.0.1 -port 8086
Visualize-table panel https://grafana.com/docs/features/panels/table_panel/
?#data with same timestamp and tags gets overwritten By design https://github.com/influxdata/influxdb/issues/4150
v2 https://v2.docs.influxdata.com/v2.0/get-started/ https://community.influxdata.com/c/getting-started https://community.influxdata.com/c/influxdb2 https://www.influxdata.com/blog/getting-started-with-influxdb-2-0-scraping-metrics-running-telegraf-querying-data-and-writing-data/ flux rpel https://docs.influxdata.com/flux/v0.24/
Key concepts: buckets https://docs.influxdata.com/flux/v0.24/introduction/getting-started
New release https://www.influxdata.com/blog/introducing-the-next-generation-influxdb-2-0-platform/
(Optional) Copy the influx and influxd binary to your $PATH sudo cp influxdb_2.0.0-alpha.8_darwin_amd64/{influx,influxd} /usr/local/bin/
influxd --http-bind-address=127.0.0.1:9999
# 2.2.2 Example
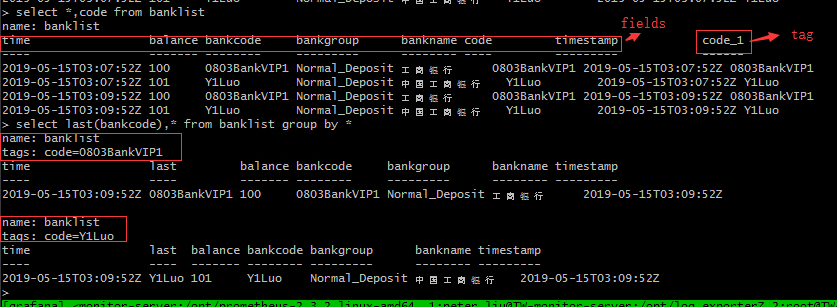
Influxdb query last row of all series in a measurement https://community.influxdata.com/t/influxdb-query-last-row-of-all-series-in-a-measurement/4915/3https://community.influxdata.com/t/influxdb-query-last-row-of-all-series-in-a-measurement/4915 https://stackoverflow.com/questions/29193898/influxdb-getting-only-last-value-in-query/56141349#56141349
from prometheus_client.core import Metric,GaugeMetricFamily, CounterMetricFamily, REGISTRY
from prometheus_client import Gauge
from prometheus_client import start_http_server
import time
import argparse
import requests
from datetime import datetime,timedelta
from influxdb import InfluxDBClient

class CustomCollector(object):
	def __init__(self):
     	self.client = InfluxDBClient(host='localhost', port=8087, database="TEST")
	def collect(self):
    	r = requests.get("http://localhost/api/GetBankAccount")
    	#print(r)
    	data = r.json()
    	#print(data)
    	print(len(data["List"]))
    	metric = Metric("banks","bank list","gauge")
    	index = 0

    	current_time = real_time = datetime.utcnow()
    	points = []
    	for item in data["List"]:
            	index+=1
            	group='NA'
            	if item["group"] is not None:
                    	group = item["group"]
            	metric.add_sample("bank_"+str(index), value=item["BALANCE"],labels={"type":"bank",'bankname': item["BANKNAME"],"code":item["CODE"],"group":group})
            	json_body = {
                    	"measurement": "banklist",
                    	"time": real_time.strftime('%Y-%m-%dT%H:%M:%SZ'),
                    	"tags":{
                            	"code":item["CODE"]
                    	},
                    	"fields": {
                            	"timestamp": real_time.strftime('%Y-%m-%dT%H:%M:%SZ'),
                            	"balance": item["BALANCE"],
                            	"bankname": item["BANKNAME"],
                            	"bankcode":item["CODE"],
                            	"bankgroup":group
                    	}
            	}
            	print("Write points: {0}".format(json_body))
            	points.append(json_body)
            	current_time = current_time+timedelta(seconds=1)
    	if len(points)>0:
            	self.client.write_points(points)
    	yield metric
if __name__ == '__main__':
	# Start up the server to expose the metrics.
	parser = argparse.ArgumentParser()
	parser.add_argument('-p', '--port', help="The port the metrics is serving from.", required=True)

	args = parser.parse_args()
	start_http_server(int(args.port))
	REGISTRY.register(CustomCollector())
while True: time.sleep(60)
https://thingsmatic.com/2017/03/02/influxdb-and-grafana-for-sensor-time-series/
# 3. Monitor Examples
# 3.1 Postgresql monitor
Why pgwatch2? https://www.cybertec-postgresql.com/en/announcing-pgwatch2-a-simple-but-versatile-postgresql-monitoring-tool/
https://github.com/cybertec-postgresql/pgwatch2
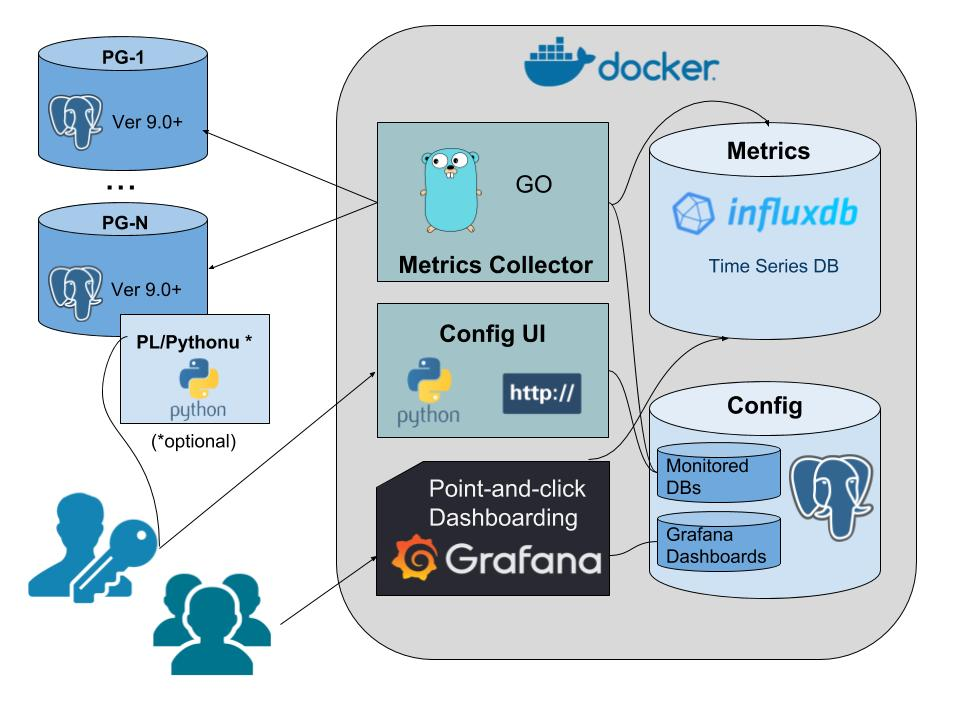
# 3.1.1 Introduction
1)Project background For more background on the project motivations and design goals see the original series of blogposts announcing the project: ● Project announcement ● Implementation details ● Feature pack 1 ● Feature pack 2 ● Feature pack 3
2)Source Code explain
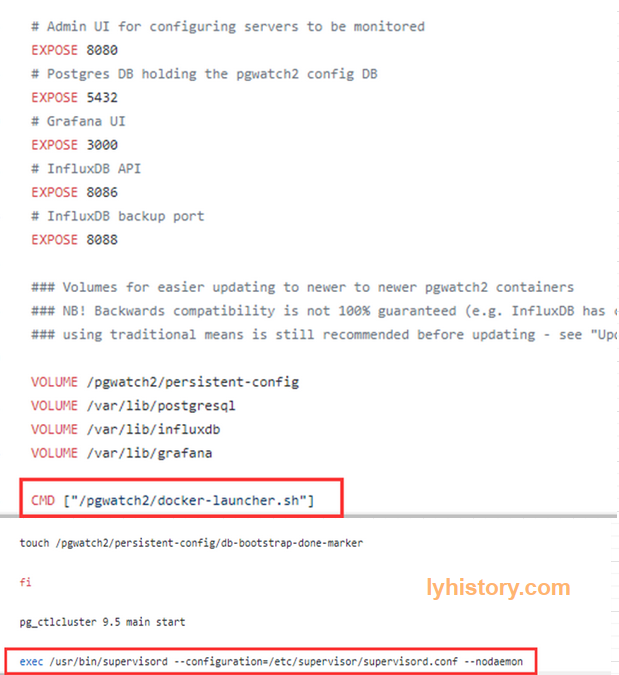 pgwatch2/Dockerfile
pgwatch2/docker-launcher.sh https://github.com/cybertec-postgresql/pgwatch2/blob/9eb5ac699df9873d2138f94dc35e1ba509dd82a6/docker-launcher.sh
Supervisord http://supervisord.org/
pgwatch2/supervisord.conf
http://blog.51cto.com/youerning/1714627 https://blog.csdn.net/vbaspdelphi/article/details/53324673 Auto start on system start /etc/init.d/supervisor https://serverfault.com/questions/96499/how-to-automatically-start-supervisord-on-linux-ubuntu
# 3.1.2 setup
# 3.1.2.1 env
# 3.1.2.2 install/upgrade grafana
wget https://s3-us-west-2.amazonaws.com/grafana-releases/release/grafana-5.2.2-1.x86_64.rpm sudo yum localinstall grafana-5.2.2-1.x86_64.rpm http://docs.grafana.org/installation/upgrading/
sudo yum install https://s3-us-west-2.amazonaws.com/grafana-releases/release/grafana-5.2.2-1.x86_64.rpm /etc/grafna/grafana.ini
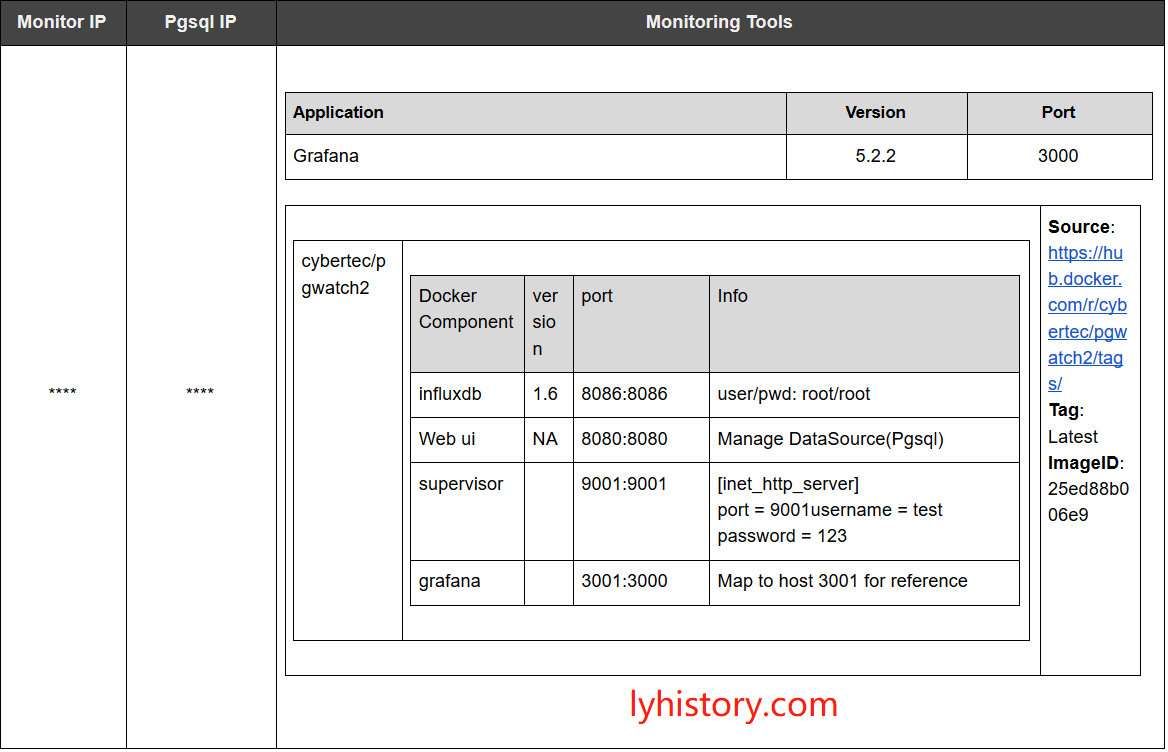
# 3.1.2.3 run integrated docker image
- run docker pull https://hub.docker.com/r/cybertec/pgwatch2/tags/ sudo docker run -d -p 8080:8080 -p 8086:8086 -p 9001:9001 -p 3001:3000 --name pw2 cybertec/pgwatch2 sudo docker exec -ti pw2 /bin/bash Note: don’t follow instructions given by pgwatch2, failed if using the cmd below, need to check the reason: sudo docker run -d -p 8080:8080 -p 9001:9001 -p 3001:3000 -e PW2_GRAFANA_BASEURL='http://10.20.70.205:3000' --name pw2
In order to avoid conflicts with existing grafana, we use host port 3001 mapping to docker grafana 3000, 9001 is for supervisor UI, 8080 is for the web ui, 8086 is for influx db
- Postgresql server config At pgsql server: pgsql -p 6432 /c oureadb create role pgwatch2 with login password 'secret'; /i pgwatch2/sql/metric_fetching_helpers/stat_activity_wrapper.sql CREATE EXTENSION pg_stat_statements; CREATE EXTENSION plpythonu; /i pgwatch2/sql/metric_fetching_helpers/stat_statements_wrapper.sql /i pgwatch2/sql/metric_fetching_helpers/cpu_load_plpythonu.sql
Add user to pgbouncer
- config supervisor http server
root@28daac38a798:/# supervisor
supervisorctl  supervisord
root@28daac38a798:/# supervisorctl stop
Error: stop requires a process name
stop <name>         	Stop a process
stop <gname>:*      	Stop all processes in a group
stop <name> <name>  	Stop multiple processes or groups
stop all            	Stop all processes

root@28daac38a798:/# ps -lef|grep "super"
4 S root     	1 	0  0  80   0 - 12459 poll_s 08:55 ?    	00:00:00 /usr/bin/python /usr/bin/supervisord --configuration=/etc/supervisor/supervisord.conf --nodaemon
root@28daac38a798:/# netstat -anp|grep :9001
tcp    	0  	0 0.0.0.0:9001        	0.0.0.0:*           	LISTEN  	1/python
root@28daac38a798:/#
Modify /etc/supervisor/supervisord.conf add: [inet_http_server] port = 9001 username = user password = 123 But how to restart with configuration changes or reload? http://www.onurguzel.com/supervisord-restarting-and-reloading/
?# pgwatch2 fatal error check /var/log/supervisor/
- Add postgresql db config at WebUI http://hostip:8080/dbs Name: dbname Host: port: db: Username: pgwatch2, password: secret
Note: by default there is a test database, removing from here is useless, because I find the test database still in influxdb, so from grafana you still can see test in the list, the way to get rid of it is change the Variables config in 4) from default SHOW TAG VALUES WITH KEY = "dbname" To SHOW TAG VALUES WITH KEY = "dbname" where "dbname" !~ /(test)+/
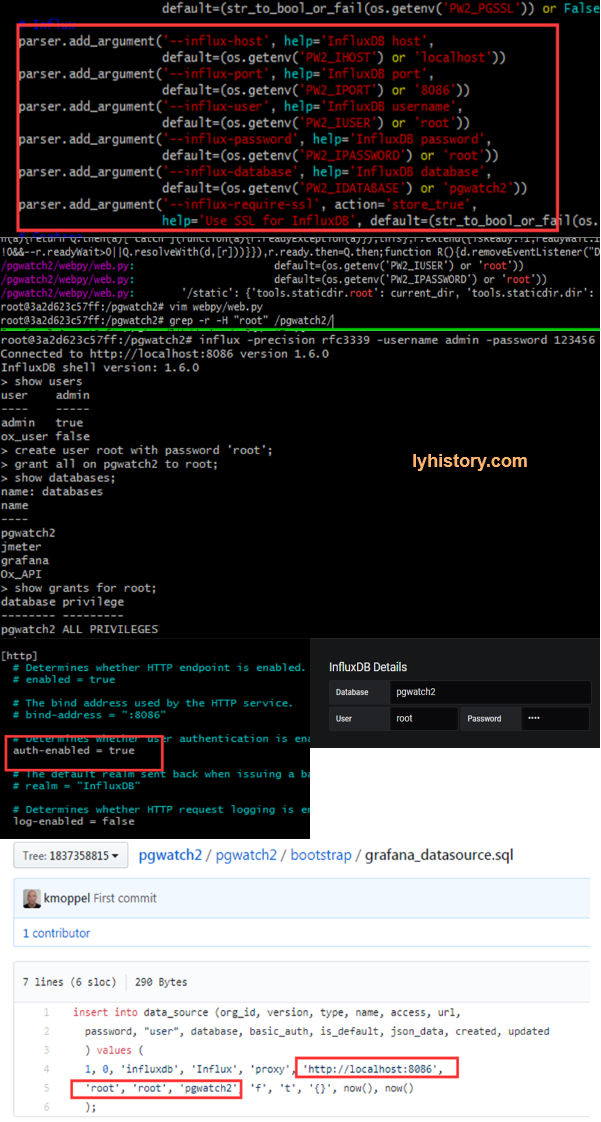
- grafana config http://hostip:3000/datasources Add influxdb datasource: Influx InfluxDB http://localhost:8086 Database: pgwatch2, username: root, password: root Make it default source, otherwise you have to make changes to all the dashboards to specify the datasource from default to influx
User and password is required here, because by default, influxdb disable authentication, pls refer to below how to enable and config with auth enabled
Add Monitor script: https://github.com/cybertec-postgresql/pgwatch2/tree/master/grafana_dashboards/v5
Change dashboard setting: Variables -> edit Datasource: select influxdb Query: change SHOW TAG VALUES WITH KEY = "dbname" To SHOW TAG VALUES WITH KEY = "dbname" where "dbname" !~ /(test)+/
# 3.1.2.4 results
Available measurements (InfluxDB "tables" with metric info) overview
NB! Metrics that are actually gathered need to be configured for every DB separately - for that open the Web UI config page or modify the "pgwatch2.monitored_host" table directly in the "pgwatch2" database
backends - active, total, waiting sessions
pgbouncer_stats - pgbouncer (1.8+) statistics
bgwriter - pg_stat_bgwriter snapshots
blocking_locks - detailed info on sessions that are waiting
cpu_load - CPU load info acquired via a plpython sproc (/pgwatch2/sql/metric_fetching_helpers/)
db_stats - pg_stat_database snapshots + DB size info
index_stats - pg_stat_user_indexes snapshots
kpi - most important high level metrics
locks - different locktype (page, tuple, ...) counts. NB! for usable data one should set the polling interval very low
locks_mode - different lock-mode (exclusive, share) counts. NB! for usable data one should set the polling interval very low
replication - pg_stat_replication info (including replica lag)
sproc_stats - pg_stat_user_functions snapshots
table_io_stats - pg_statio_user_tables snapshots
stat_statements - pg_stat_statements snapshots (requires the extension)
stat_statements_calls - total query count according to pg_stat_statements
table_bloat_approx_summary - bloat summary for the whole DB (needs pgstattuple extension)
table_stats - pg_stat_user_tables snapshots
wal - pg_current_(xlog_location|wal_lsn) values

For getting started with Grafana in general start here
For learning InfluxDB query language InfluxQL start here
When stuck then additional support and consultations are available from Cybertec here
# 3.1.3 Lesson Learned
# 3.1.3.1 auth
So many auth in so many places!!! Grafana - add datasource - Auth
This is different for varaires datasource, need to specifiy accoridingly
For example, for prometheus, it has a default web portal, basic auth is to protect it from access by non authenticated user, And also protect from http api call Securing Prometheus with Basic Auth for Grafana https://www.youtube.com/watch?time_continue=431&v=oPlk0GHYmrE
In the influxdb example here, we didn’t user basic auth, because:
- In latest influxdb, it already removed the web portal
- Influxdb has its own authentication, by config: Enable auth will affect current pgwatch2, so we need add deafult user root for pgwatch2
Create user admin with password ‘123456’ with all priveleges; /etc/influxdb/influxdb.conf After restart, influx -precision rfc3339 -username admin -password 123456
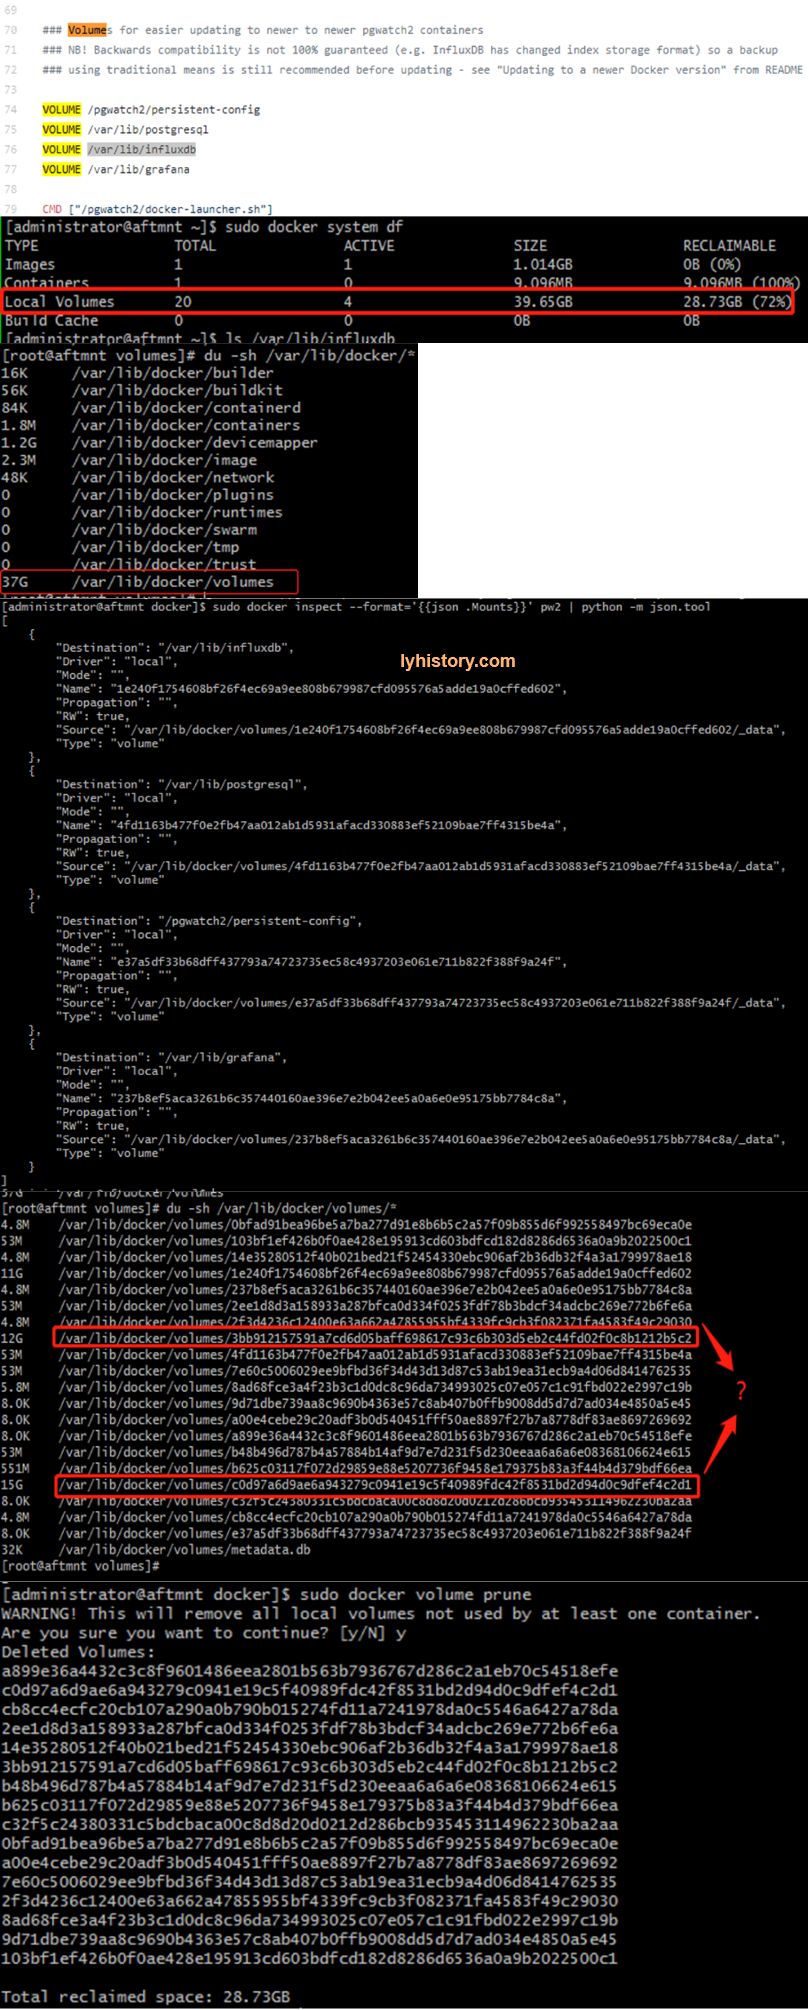
# 3.1.3.2 docker local volumes
https://github.com/cybertec-postgresql/pgwatch2/blob/master/Dockerfile https://dzone.com/articles/demystifying-the-data-volume-storage-in-docker https://docs.docker.com/engine/reference/commandline/volume_inspect/
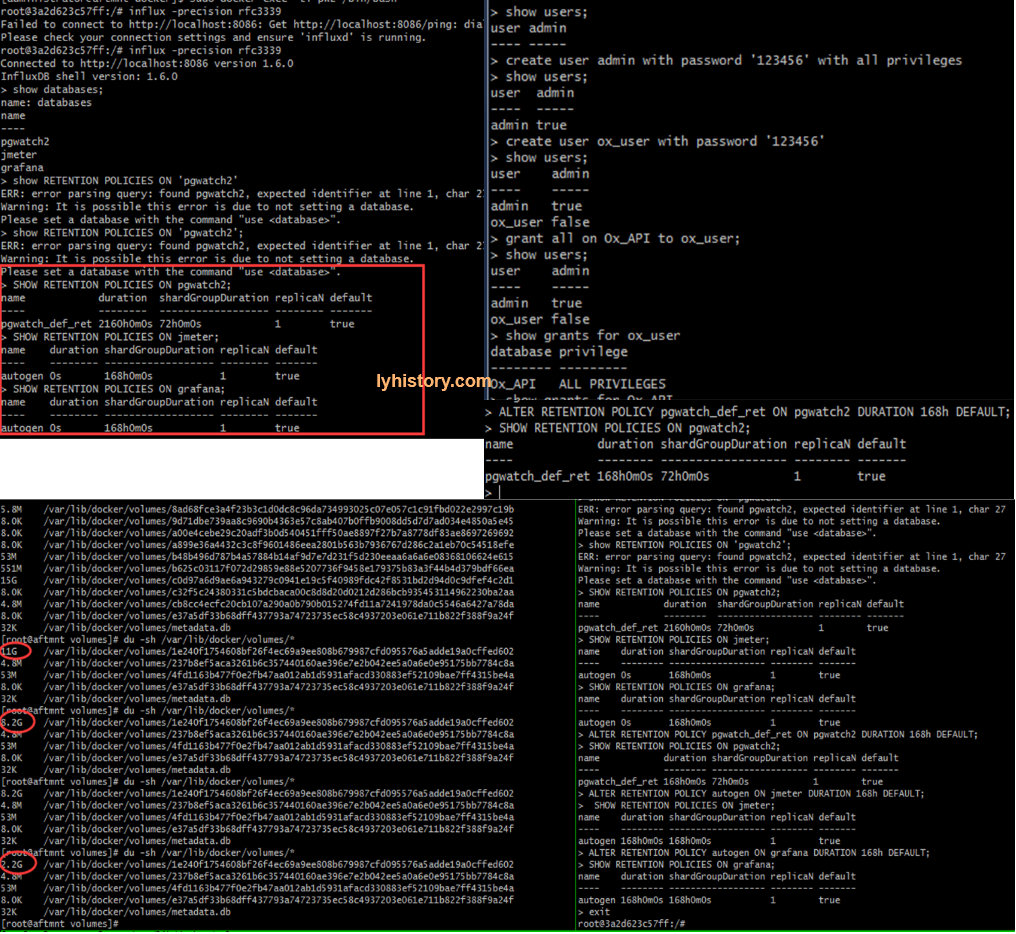
# 3.1.3.3 influxdb
https://docs.influxdata.com/influxdb/v1.6/query_language/schema_exploration/ #retention policy https://docs.influxdata.com/influxdb/v1.2/query_language/database_management/#create-retention-policies-with-create-retention-policy,https://community.influxdata.com/t/what-is-the-retention-policy-and-how-exactly-it-work/1080/3 Querying data in a non-DEFAULT retention policy https://www.influxdata.com/blog/tldr-influxdb-tech-tips-april-27-2017/ Retention policies not dropping old data https://community.influxdata.com/t/retention-policies-not-dropping-old-data/4538
# 3.1.3.4 Shift to existing grafana
- PW2_GRAFANA_BASEURL doesn’t work Need to check scripts
sudo docker run -d -p 8080:8080 -p 8086:8086 -p 9001:9001 -p 3001:3000 -e PW2_GRAFANA_BASEURL='http://10.20.70.205:3000' --name pw2 cybertec/pgwatch2
- instructions not clear check section "To use an existing Grafana installation" in https://github.com/cybertec-postgresql/pgwatch2
# 3.1.3.5 backup & upgrade
Need to explore and refer to “Updating to a newer Docker version” (https://github.com/cybertec-postgresql/pgwatch2)
# 3.1.4 Trouble shoot
cd /tmp/
wget https://s3-us-west-2.amazonaws.com/grafana-releases/release/grafana-5.2.2-1.x86_64.rpm
sudo yum localinstall grafana-5.2.2-1.x86_64.rpm

git clone https://github.com/cybertec-postgresql/pgwatch2.git
sudo git clone https://github.com/cybertec-postgresql/pgwatch2.git

sudo docker pull cybertec/pgwatch2
sudo docker images

sudo netstat -anp|grep :8080
##sudo docker run -d -p 8080:8080 -p 9001:9001 -p 3001:3000 --name pw2 cybertec/pgwatch2
##sudo docker run -d -p 8080:8080 -p 9001:9001 -p 3001:3000 -e PW2_GRAFANA_BASEURL='http://10.20.70.205:3000' --name pw2 cybertec/pgwatch2
sudo docker run -d -p 8080:8080 -p 8086:8086 -p 9001:9001 -p 3001:3000 --name pw2 cybertec/pgwatch2
sudo docker ps -a

##    sudo vi /etc/grafana/grafana.ini
##   	 ;type = postgres
##   	 ;host = 10.20.70.168:6432
##   	 ;name = oureadb
##   	 ;user = pgwatch2
##   	 # If the password contains # or ; you have to wrap it with trippel quotes. Ex """#password;"""
##   	 ;password = secret

sudo docker exec -ti pw2 /bin/bash
    apt-get install net-tools
    service supervisor status
    ps -lef|grep "super"
   	 /usr/bin/supervisord --configuration=/etc/supervisor/supervisord.conf --nodaemon
    vi /etc/supervisor/supervisord.conf
   	 [inet_http_server]
   	 port = 9001
   	 username = peter
   	 password = 123456
    service supervisor restart
	    influx -precision rfc3339
		influx -precision rfc3339 -username admin -password 123456
   	        show databases
			show grants for root;
			grant all on pgwatch2 to root;
   	        use pgwatch2
			show measurements
			select * from backends limit 1
       SHOW TAG VALUES WITH KEY = "dbname" where "dbname" !~ /(test)+/
	vi /pgwatch2/webpy/pgwatch2_influx.py
		modify influx_connect_params
sudo docker start pw2
    netstat -anp|grep :9001
    netstat -anp|egrep :8080
    ps -lef|egrep "35|PID"
    ls -l /proc/35/exe
    cat /proc/35/cmdline | xargs -0 echo
    ps -p 35 -o cmd
    vi /etc/grafana/grafana.ini
   	 [server]
   	 protocol = http
   	 cert_file = /pgwatch2/persistent-config/self-signed-ssl.pem
   	 cert_key = /pgwatch2/persistent-config/self-signed-ssl.key

   	 [database]
   	 type = postgres
   	 host = 127.0.0.1:5432
   	 name = pgwatch2_grafana
   	 user = pgwatch2
   	 password = pgwatch2admin

   	 [security]
   	 admin_user = admin
   	 admin_password = pgwatch2admin

   	 [auth.anonymous]
   	 enabled = true

   	 [metrics]
   	 enabled = false

sudo docker top 0c7180296ad6

sudo systemctl status grafana-server
sudo systemctl start grafana-server
journalctl -xe

telnet 10.20.70.168 6432
journalctl -xe

http://10.20.70.205:8080/dbs
oureadb
10.20.70.168 6432 oureadb pgwatch2 secret
?# postgresql connection timeout
Test on monitor server(running docker), try to connect use pgql
yum localinstall https://download.postgresql.org/pub/repos/yum/11/redhat/rhel-7-x86_64/pgdg-centos11-11-2.noarch.rpm
yum list postgres*
yum install postgresql11.x86_64
psql -h
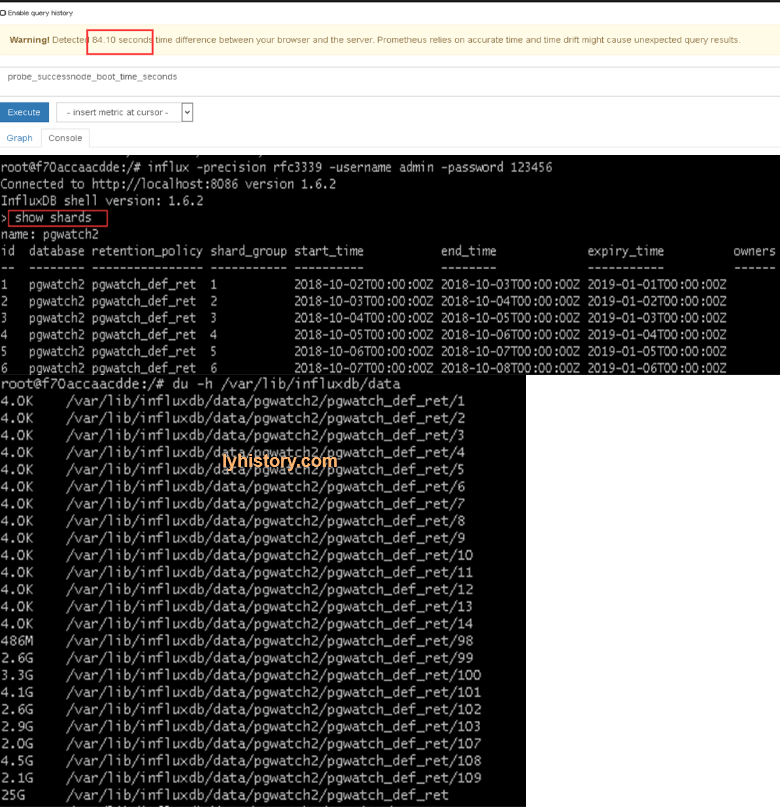
?# prometheus not work => caused by server diskspace used up => caused by pgwatch2 influxdb use up space=>caused by pgwatch metrics preset config(full will scrape too much data)
Server date ahead of real datetime
Root disk space used up
Influxdb used up space
vim /etc/influxdb/influxdb.conf modify check-interval
du -h /var/lib/influxdb/data
?# Grafana did not display the records in the expected order in table very simple solution : click on max/average whatever column you want to sort, click it once or twice until the result is sorted in your expected order, then save, so next time when you open it, it will display in expected sort order, actually what happens is the grafana json file will change to for example: "legend": { "alignAsTable": true, "avg": true, "current": true, "max": true, "min": false, "rightSide": true, "show": true, "sideWidth": 300, "sort": "max", "sortDesc": true, "total": true, "values": true }, ppl asking and discussing it here https://community.grafana.com/t/grafana-did-not-display-the-records-in-the-expected-order-in-table/4564 and https://groups.io/g/grafana/topic/prometheus_data_not_sorted/4314229?p=,,,20,0,0,0::recentpostdate%2Fsticky,,,20,0,0,4314229
# 3.2 Node Exporter Server Metrics
# 3.2.1 Linux
Install node_exporter released for prometheus and config in prometheus https://prometheus.io/docs/guides/node-exporter/#installing-and-running-the-node-exporter Grafana dashboard
Check http://...:9100/metrics
OR
building running from source:
go get github.com/prometheus/node_exporter
cd ${GOPATH-$HOME/go}/src/github.com/prometheus/node_exporter
make
./node_exporter
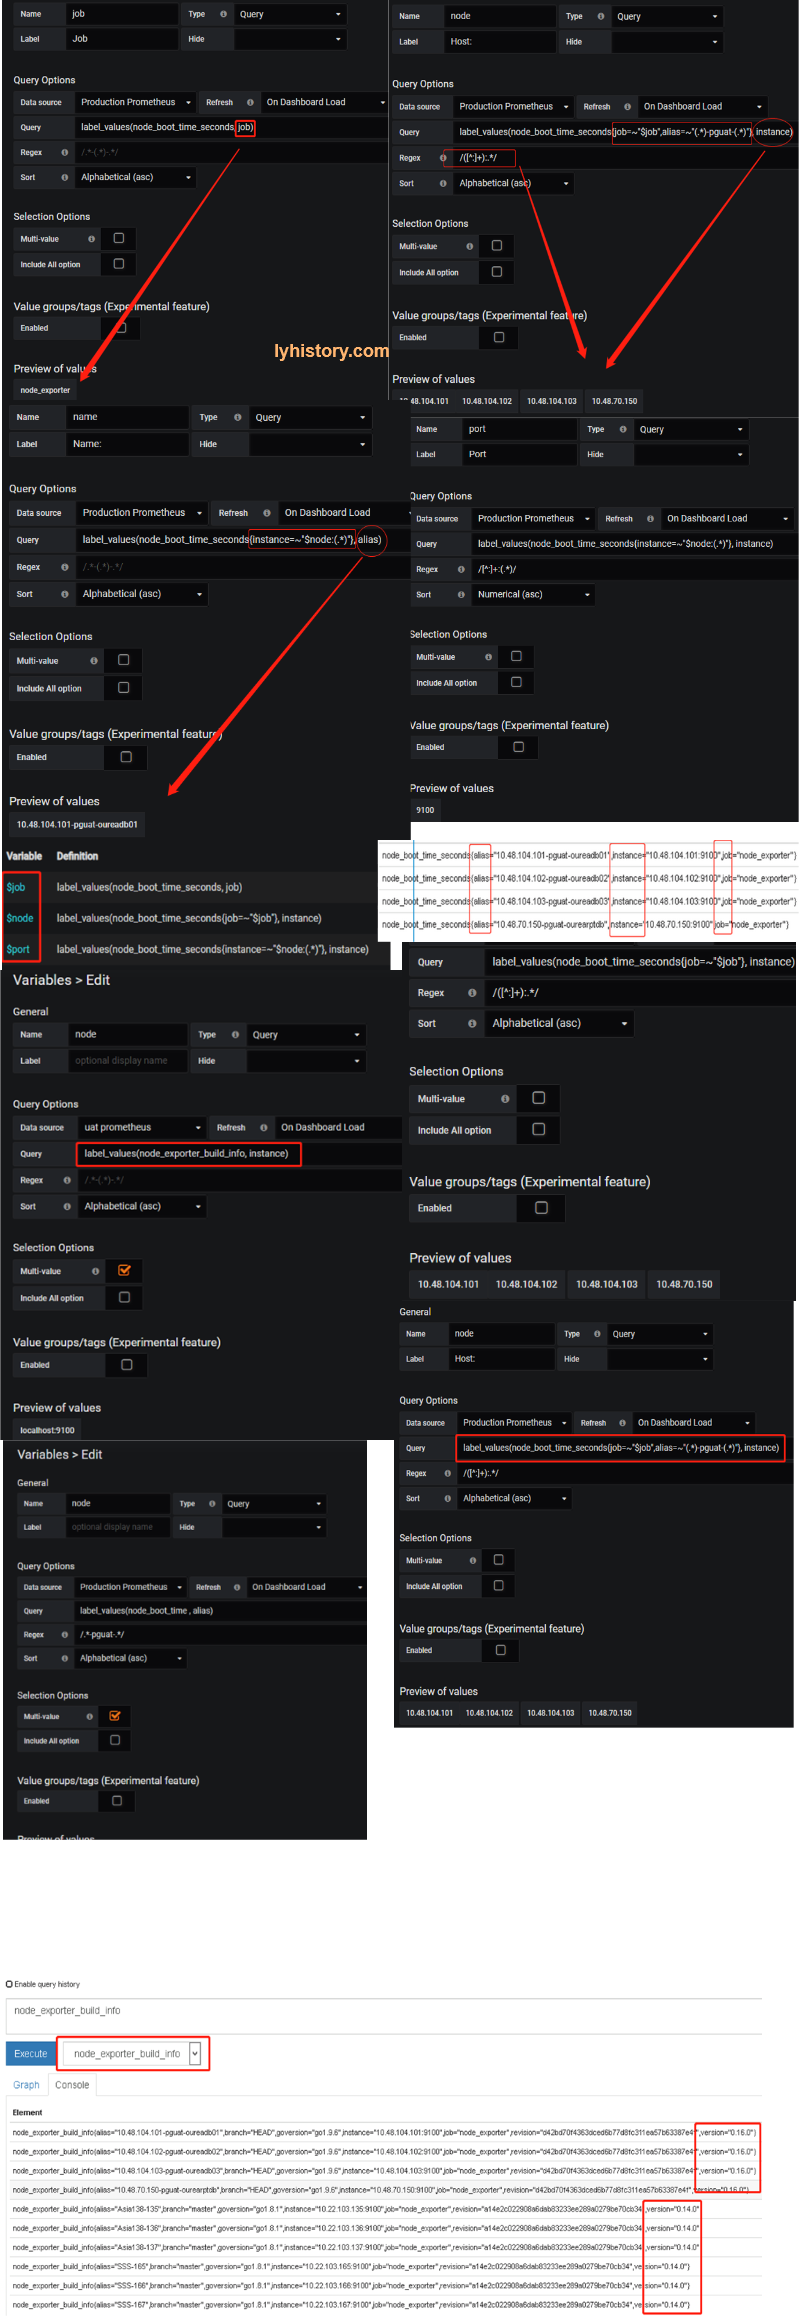
Add alias, never change original variables,
?# node_exporter(latest Version 0.16.0) not showing on dashbaord Because of naming changed https://www.robustperception.io/new-features-in-node-exporter-0-16-0 Use the latest grafana dashboard https://grafana.com/dashboards/1860 And check from prometheus web portal to confirm the query statement
?# # multiple series error Fixed by itself after a while
Not verified link: http://d-prototype.com/archives/9672
# 3.2.2 Windows
Windows support is removed by node exporter, the wmi_exporter is recommended as a replacement. https://github.com/martinlindhe/wmi_exporter https://grafana.com/dashboards/2129
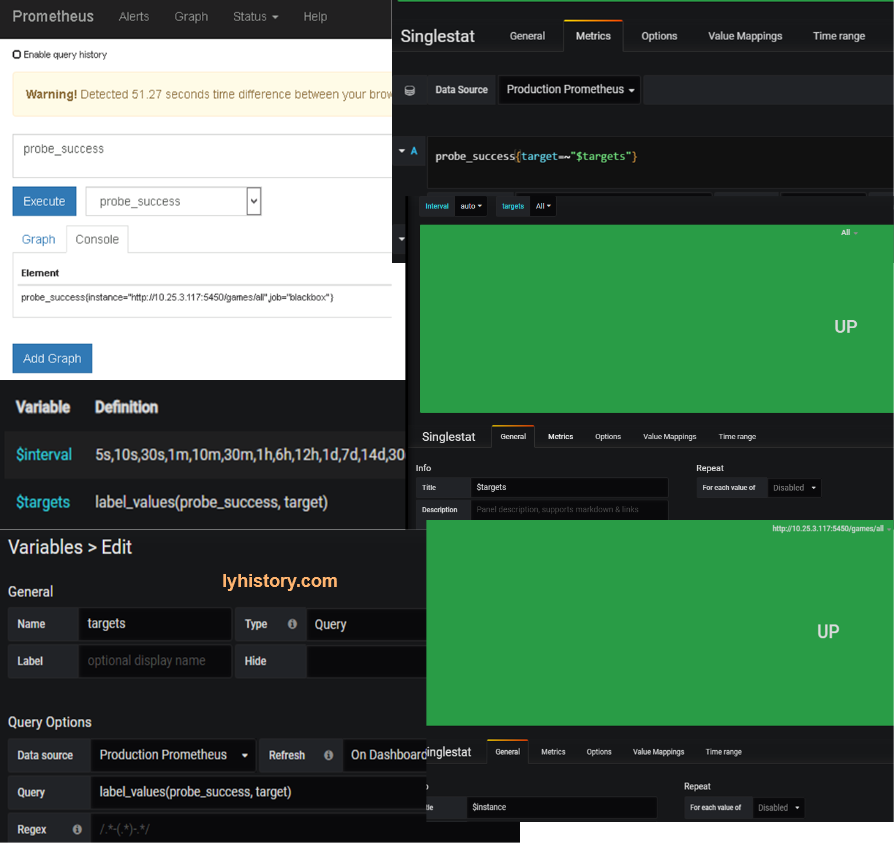
# 3.3 Server alive monitor - http request 200 OK
Endpoint prob - Blackbox-exporter https://github.com/prometheus/blackbox_exporter
https://cloudprober.org/how-to/external-probe/
https://grafana.com/dashboards/5345
Alert http://docs.grafana.org/alerting/notifications/#all-supported-notifier
# 3.4 More prometheus exporter
Btc exporter https://grafana.com/dashboards/6973 https://github.com/hunterlong/btcexporter
docker run -it -d -p 9019:9019 -v /opt/btc/btcexporter/addresses.txt:/app/addresses.txt hunterlong/btcexporter

ps -lef|grep “prome”
ls /proc/<PID>/exe
vi /path/prometheus.yml
kill -HUP <PID>
http://10.20.70.205:9019/metrics
how to Customize exporter?
promethus lib https://prometheus.io/docs/instrumenting/writing_exporters/ python https://github.com/prometheus/client_python#custom-collectors go https://redbyte.eu/en/blog/real-time-metrics-using-prometheus-and-grafana/
# 3.5 More Monitor with prometheus|influxdb
Real Time performance monitor for .NET CORE .Net Core 2.0+ InfluxDB+Grafana+App Metrics 实现跨平台的实时性能监控 https://www.cnblogs.com/landonzeng/p/7904402.html
http request/traffic | web api monitor nodejs http://swaggerstats.io/docs.html
java perform monitor https://github.com/stagemonitor/stagemonitor/wiki/Installation
# 3.6 Project Monitor CI with Jenkins(nothing to do with prometheus&influxdb)
CI-Jenkins https://jenkins.io/doc/tutorials/
Docker mode:
docker pull jenkinsci/blueocean
docker run \
  --rm \
  -u root \
  -p 8080:8080 \
  -v jenkins-data:/var/jenkins_home \
  -v /var/run/docker.sock:/var/run/docker.sock \
  -v "$HOME":/home \
  jenkinsci/blueocean
docker exec -ti 0dc7a2730c43 bash
Find initial password: docker log 0dc7a2730c43 UI: http://192.168.56.101:8080/ Work path: /var/jenkins_home/workspace
Use Maven:: ?#maven not found https://my.oschina.net/u/2450666/blog/844170 https://stackoverflow.com/questions/45777031/maven-not-found-in-jenkins/56833922#56833922
export MAVEN_HOME=/opt/maven
export PATH=$PATH:$MAVEN_HOME/bin
mvn --version
mvn clean compile
mvn clean install
mvn clean package -P dev
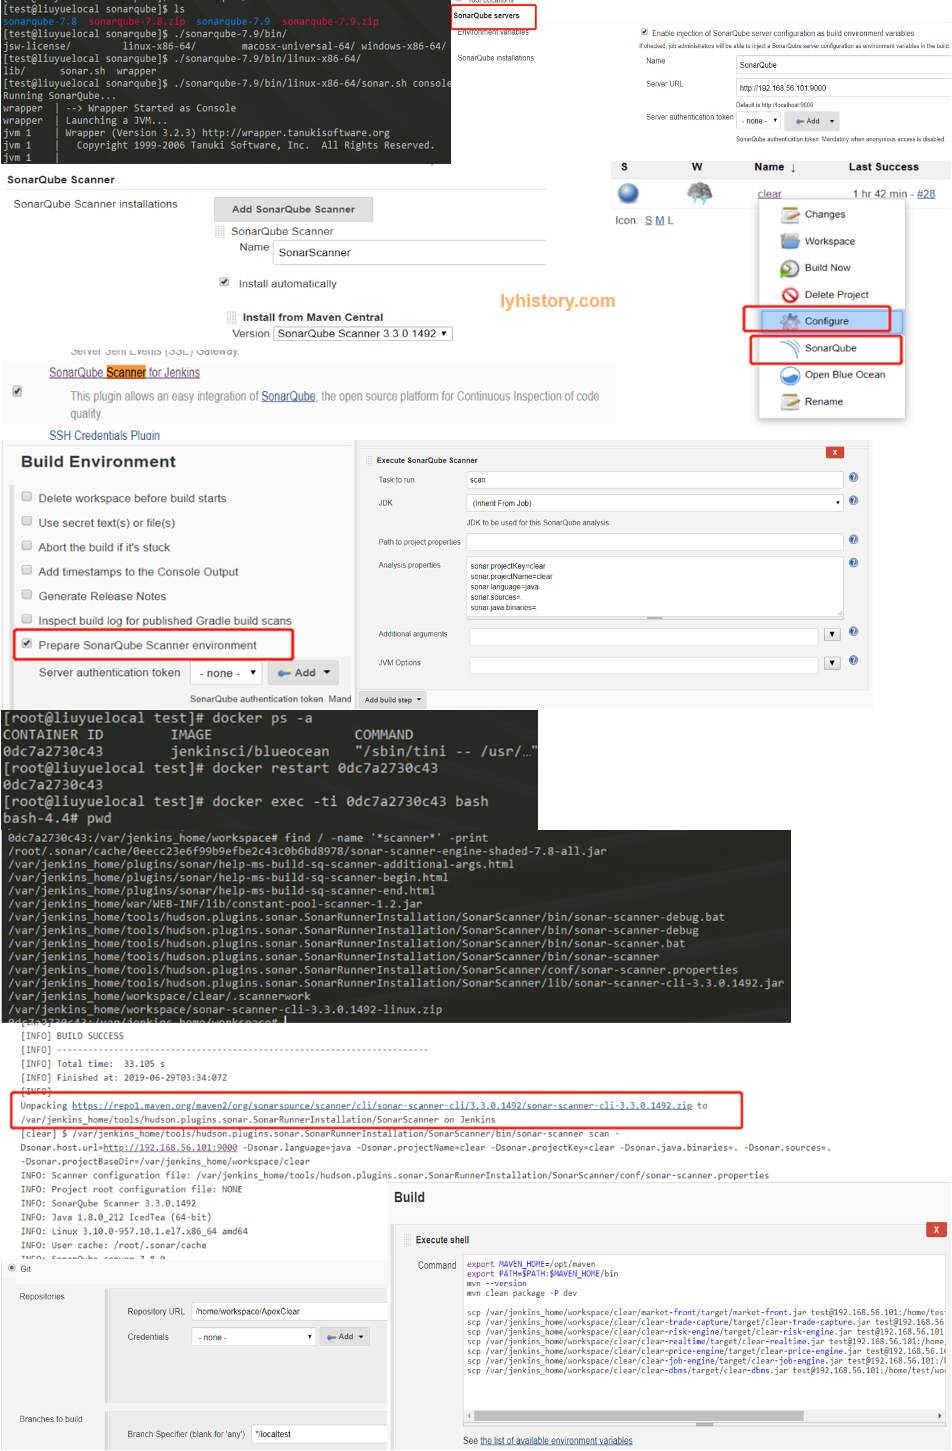
Use Sonarqube:: https://docs.sonarqube.org/latest/setup/get-started-2-minutes/ Java version requirements: https://docs.sonarqube.org/7.8/requirements/requirements/ java.io.IOException: Cannot run program "sonar-scanner" error=2, No such file or directory https://docs.sonarqube.org/latest/analysis/scan/sonarscanner-for-jenkins/ Jenkins+sonar+sonar-scanner https://www.jianshu.com/p/27e6ed4f6dbc
Start sonar.sh on host machine: cd /home/test/workspace/sonarqube ./sonarqube-7.8/bin/linux-x86-64/sonar.sh console
Install sonarscanner on docker/jenkins sudo docker cp /home/test/workspace/test/sourcecode/ 0dc7a2730c43:/home/workspace/
Pipline https://jenkins.io/doc/tutorials/build-a-java-app-with-maven/
ref
实战 Prometheus 搭建监控系统 https://www.codercto.com/a/35819.html