real 实际时间:程序运行的实际时长。
user 用户时间:程序在用户态运行的时长。
sys 系统时间:程序在内核态运行的时长。
注意:多核处理器存在用户时间+系统时间 > 实际时间的情况。
系统启动过程
-
内核的引导
-
运行 init
-
SysV: init, CentOS 5之前, 配置文件:/etc/inittab。
-
Upstart: init,CentOS 6, 配置文件:/etc/inittab, /etc/init/*.conf。
-
Systemd: systemd, CentOS 7,配置文件:/usr/lib/systemd/system、 /etc/systemd/system
-
系统初始化
-
建立终端
-
用户登录系统
系统参数
cat /etc/os-release

hostnamectl

hostnamectl status
LVS - Linux Virtual Server,即 Linux 虚拟服务器, Linux2.4 内核以后,LVS 已经是 Linux 标准内核的一部分
uname -a
linux show architecture uname -m
x86-64 (also called x86_64, x64, or amd64) is the 64-bit CPU architecture that is used in Intel and AMD processors. It is an extension to the 32-bit x86 (i386) architecture. The x86-64 architecture is used in most CPUs for home computers and servers in use today.
intel 与 amd 厂商使用的是基于X86架构的CPU,X86架构使用的是复杂指令集即指令一步到位,而arm使用的是精简指令集即指令由几个指令完成。 X86架构性能好,但是耗电多、电压高,主要用于桌面合服务器。 然而ARM架构耗电少、电压低,但是单核性能不如X86,主要用于移动设备。 近几年来,X86架构发展迟缓,ARM架构进步显著,已经从移动设备向桌面电脑和服务器进军了,如m1芯片。
cpu
概念:
- 处理器
- 核
- 硬件线程
- CPU内存缓存
- 时钟频率
- 每指令周期数CPI和每周期指令数IPC
- CPU指令
- 使用率
- 用户时间/内核时间
- 调度器
- 运行队列
- 抢占
- 多进程
- 多线程
- 字长
cat /proc/cpuinfo
针对应用程序,我们通常关注的是内核CPU调度器功能和性能。
线程的状态分析主要是分析线程的时间用在什么地方,而线程状态的分类一般分为:
a. on-CPU:执行中,执行中的时间通常又分为用户态时间user和系统态时间sys。 b. off-CPU:等待下一轮上CPU,或者等待I/O、锁、换页等等,其状态可以细分为可执行、匿名换页、睡眠、锁、空闲等状态。
分析工具:
-
uptime,vmstat,mpstat,top,pidstat只能查询到cpu及负载的的使用情况。
-
perf可以跟着到进程内部具体函数耗时情况,并且可以指定内核函数进行统计,指哪打哪。
//查看系统cpu使用情况
top

//查看所有cpu核信息
mpstat -P ALL 1

//查看cpu使用情况以及平均负载
vmstat 1

//进程cpu的统计信息
pidstat -u 1 -p pid

//跟踪进程内部函数级cpu使用情况
perf top -p pid -e cpu-clock

//统计系统调用耗时情况
strace -c -p pid

//跟踪指定的系统操作例如epoll_wait
strace -T -e epoll_wait -p pid

//查看内核日志信息
dmesg
内存
从软件和硬件角度去看内存 https://mp.weixin.qq.com/s/Br7uEIz_LOJXg8v7CXJKgQ
- 主存
- 虚拟内存
- 常驻内存
- 地址空间
- OOM
- 页缓存
- 缺页
- 换页
- 交换空间
- 交换
- 用户分配器libc、glibc、libmalloc和mtmalloc
- LINUX内核级SLUB分配器
分析工具:
free,vmstat,top,pidstat,pmap只能统计内存信息以及进程的内存使用情况。
valgrind可以分析内存泄漏问题。
dtrace动态跟踪。需要对内核函数有很深入的了解,通过D语言编写脚本完成跟踪。
//查看系统内存使用情况
free -m

//虚拟内存统计信息
vmstat 1

//查看系统内存情况
top

//1s采集周期,获取内存的统计信息
pidstat -p pid -r 1

//查看进程的内存映像信息
pmap -d pid

//检测程序内存问题
valgrind --tool=memcheck --leak-check=full --log-file=./log.txt  ./程序名
cat /proc/meminfo
top shift+E 切换 bytes Mb Gb
top - 17:14:51 up 419 days, 41 min, 1 user, load average: 1.51, 1.40, 1.42 Tasks: 302 total, 1 running, 301 sleeping, 0 stopped, 0 zombie %Cpu(s): 9.1 us, 0.4 sy, 0.0 ni, 90.4 id, 0.0 wa, 0.0 hi, 0.1 si, 0.0 st GiB Mem : 62.8 total, 16.9 free, 13.6 used, 32.2 buff/cache GiB Swap: 20.0 total, 20.0 free, 0.0 used. 48.1 avail Mem
PID USER PR NI VIRT RES SHR S %CPU %MEM TIME+ COMMAND 19363 flink 20 0 15.7g 7.1g 60792 S 147.0 11.4 1929:48 java 2650 kafka 20 0 10.2g 1.2g 17980 S 2.3 1.8 39:12.25 java
https://serverfault.com/questions/85470/meaning-of-the-buffers-cache-line-in-the-output-of-free
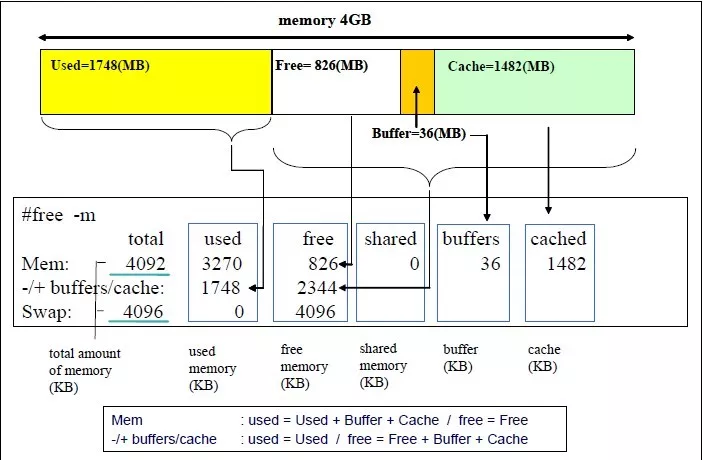
GiB Mem total = free+used+buff/cache
- total (Mem): Your total (physical) RAM (excluding a small bit that the kernel permanently reserves for itself at startup); total installed memory (that is MemTotal from /proc/meminfo), this all the memory in RAM
- used (Mem): used memory, equal to total - free - buffers - cache
- free (Mem): unused memory (that is MemFree), this all the memory that is unused for anything (even caches) in RAM
- shared (Mem): this is the amount of memory used mainly for tmpfs (Shmem)
- buff/cache (Mem),
sum of buffers and cache:
- buffers: memory used by kernel buffers (Buffers), which is memory that the kernel can take advantage of
- cache: memory used by the page cache and slabs (Cached and SReclaimable). The page cache contains the contents of files in the filesystem cached to RAM, and it is generally a good thing for this to be a high number. I presume “slabs” are a similar caching feature.
- available (Mem): this is an estimate of how much memory is available for starting new applications, without swapping. It includes most of memory counted in the cache field (since the page cache can be dropped to start new applications), but it does not count swap (since it is generally preferable not to use slow swap space).
SWAP
- total (Swap): this is the total amount of disk space reserved for swap (SwapTotal in proc/meminfo). You can check by checking that this matches with the output of swapon -s.
- used (Swap): the amount of swap disk space that is currently being used. Again, you can check this by comparing it with the output of swapon -s
- free (Swap): the amount of swap disk space that is currently not being used (SwapFree in /proc/meminfo). It is equal to total (Swap) - used (Swap)
virt RES SHR
- %MEM: shows the percentage use of the total physical memory by a process
- VIRT show total memory that a process has access to, including shared memory, swapped pages, and mapped pages 表示的是进程虚拟内存空间大小。
-
RES shows the total physical memory used, including private and shared by a process 的含义是指进程虚拟内存空间中已经映射到物理内存空间的那部分的大小。
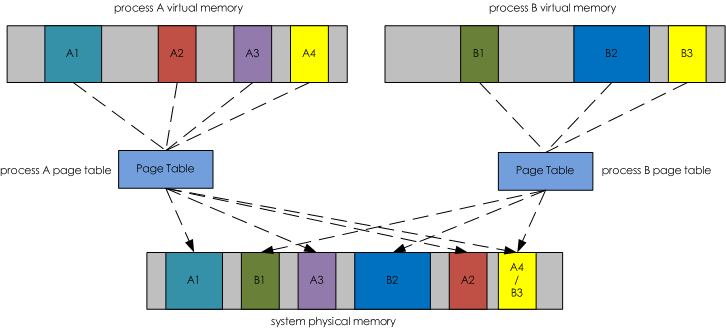
- SHR shows total physical shared memory used by a process 是share(共享)的缩写,它表示的是进程占用的共享内存大小。在上图中我们看到进程A虚拟内存空间中的A4和进程B虚拟内存空间中的B3都映射到了物理内存空间的A4/B3部分。咋一看很奇怪。为什么会出现这样的情况呢?其实我们写的程序会依赖于很多外部的动态库(.so),比如libc.so、libld.so等等。这些动态库在内存中仅仅会保存/映射一份,如果某个进程运行时需要这个动态库,那么动态加载器会将这块内存映射到对应进程的虚拟内存空间中。多个进展之间通过共享内存的方式相互通信也会出现这样的情况。这么一来,就会出现不同进程的虚拟内存空间会映射到相同的物理内存空间。这部分物理内存空间其实是被多个进程所共享的,所以我们将他们称为共享内存,用SHR来表示。某个进程占用的内存除了和别的进程共享的内存之外就是自己的独占内存了。所以要计算进程独占内存的大小只要用RES的值减去SHR值即可。
- DATA: shows the total private memory used by a process, both physical and virtual
- CODE: shows the total physical memory utilized to load applications
- SWAP: shows the total amount of swap memory available
https://mp.weixin.qq.com/s/-WG0kjK_YQxrXuPi-OebsQ https://wallenotes.github.io/2018/01/04/Linux/%E5%86%85%E5%AD%98/memory-standard-segment-layout/ https://www.orchome.com/298
磁盘IO
- 文件系统
- VFS
- 文件系统缓存
- 页缓存page cache
- 缓冲区高速缓存buffer cache
- 目录缓存
- inode
- inode缓存
- noop调用策略
分析工具:
//查看系统io信息
iotop

//统计io详细信息
iostat -d -x -k 1 10

//查看进程级io的信息
pidstat -d 1 -p  pid

//查看系统IO的请求,比如可以在发现系统IO异常时,可以使用该命令进行调查,就能指定到底是什么原因导致的IO异常
perf record -e block:block_rq_issue -ag
^C
perf report
文件描述符 fd
cd /proc/pid/fd
网络
网络的监测是所有 Linux 子系统里面最复杂的,有太多的因素在里面,比如:延迟、阻塞、冲突、丢包等,更糟的是与 Linux 主机相连的路由器、交换机、无线信号都会影响到整体网络并且很难判断是因为 Linux 网络子系统的问题还是别的设备的问题,增加了监测和判断的复杂度。现在我们使用的所有网卡都称为自适应网卡,意思是说能根据网络上的不同网络设备导致的不同网络速度和工作模式进行自动调整。
分析工具:
//显示网络统计信息
netstat -s

//显示当前UDP连接状况
netstat -nu

//显示UDP端口号的使用情况
netstat -apu

//统计机器中网络连接各个状态个数
netstat -a | awk '/^tcp/ {++S[$NF]} END {for(a in S) print a, S[a]}'

//显示TCP连接
ss -t -a

//显示sockets摘要信息
ss -s

//显示所有udp sockets
ss -u -a

//tcp,etcp状态
sar -n TCP,ETCP 1

//查看网络IO
sar -n DEV 1

//抓包以包为单位进行输出
tcpdump -i eth1 host 192.168.1.1 and port 80

//抓包以流为单位显示数据内容
tcpflow -cp host 192.168.1.1
内核编程
Kernel bypass
https://blog.cloudflare.com/kernel-bypass#/
tcp
[内核源码] tcp 连接队列 https://wenfh2020.com/2022/01/22/kernel-tcp-socket-backlog/#/
ebpf
https://ebpf.io/
一文读懂内核可编程技术eBPF Introduction to BPF | LINUX Berkeley Packet Filter | CodiLime Tutorial: Create Your First EBPF Program to Monitor Your System Using Bumblebee - Adam Sayah
辅助工具
火焰图(Flame Graph是 Bredan Gregg 创建的一种性能分析图表。
火焰图主要是用来展示 CPU的调用栈。
//安装systemtap,默认系统已安装
yum install systemtap systemtap-runtime

//内核调试库必须跟内核版本对应,例如:uname -r 2.6.18-308.el5
kernel-debuginfo-2.6.18-308.el5.x86_64.rpm
kernel-devel-2.6.18-308.el5.x86_64.rpm
kernel-debuginfo-common-2.6.18-308.el5.x86_64.rpm

//安装内核调试库
debuginfo-install --enablerepo=debuginfo search kernel
debuginfo-install --enablerepo=debuginfo  search glibc

//安装
git clone https://github.com/lidaohang/quick_location.git
cd quick_location
Appendix: init system: systemd
This powerful suite of software can manage many aspects of your server, from services to mounted devices and system states.
Units can be said to be similar to services or jobs in other init systems. However, a unit has a much broader definition, as these can be used to abstract services, network resources, devices, filesystem mounts, and isolated resource pools.
type of Units:
- .service: A service unit describes how to manage a service or application on the server. This will include how to start or stop the service, under which circumstances it should be automatically started, and the dependency and ordering information for related software.
- .socket: A socket unit file describes a network or IPC socket, or a FIFO buffer that systemd uses for socket-based activation. These always have an associated .service file that will be started when activity is seen on the socket that this unit defines.
- .device: A unit that describes a device that has been designated as needing systemd management by udev or the sysfs filesystem. Not all devices will have .device files. Some scenarios where .device units may be necessary are for ordering, mounting, and accessing the devices.
- .mount: This unit defines a mountpoint on the system to be managed by systemd. These are named after the mount path, with slashes changed to dashes. Entries within /etc/fstab can have units created automatically.
- .automount: An .automount unit configures a mountpoint that will be automatically mounted. These must be named after the mount point they refer to and must have a matching .mount unit to define the specifics of the mount.
- .swap: This unit describes swap space on the system. The name of these units must reflect the device or file path of the space.
- .target: A target unit is used to provide synchronization points for other units when booting up or changing states. They also can be used to bring the system to a new state. Other units specify their relation to targets to become tied to the target’s operations.
- .path: This unit defines a path that can be used for path-based activation. By default, a .service unit of the same base name will be started when the path reaches the specified state. This uses inotify to monitor the path for changes.
- .timer: A .timer unit defines a timer that will be managed by systemd, similar to a cron job for delayed or scheduled activation. A matching unit will be started when the timer is reached.
- .snapshot: A .snapshot unit is created automatically by the systemctl snapshot command. It allows you to reconstruct the current state of the system after making changes. Snapshots do not survive across sessions and are used to roll back temporary states.
- .slice: A .slice unit is associated with Linux Control Group nodes, allowing resources to be restricted or assigned to any processes associated with the slice. The name reflects its hierarchical position within the cgroup tree. Units are placed in certain slices by default depending on their type.
- .scope: Scope units are created automatically by systemd from information received from its bus interfaces. These are used to manage sets of system processes that are created externally.
priority:
/etc/systemd/system
/run/systemd/system
/lib/systemd/system

If you wish to override only specific directives from the system’s unit file, you can actually provide unit file snippets within a subdirectory. These will append or modify the directives of the system’s copy, allowing you to specify only the options you want to change.

The correct way to do this is to create a directory named after the unit file with .d appended on the end. So for a unit called example.service, a subdirectory called example.service.d could be created. Within this directory a file ending with .conf can be used to override or extend the attributes of the system’s unit file.

Template unit files are, in most ways, no different than regular unit files. However, these provide flexibility in configuring units by allowing certain parts of the file to utilize dynamic information that will be available at runtime.
Template unit files can be identified because they contain an @ symbol after the base unit name and before the unit type suffix. A template unit file name may look like this:
[email protected]
When an instance is created from a template, an instance identifier is placed between the @ symbol and the period signifying the start of the unit type. For example, the above template unit file could be used to create an instance unit that looks like this:
[email protected]
[Unit] Section Directives
- Description=: This directive can be used to describe the name and basic functionality of the unit. It is returned by various systemd tools, so it is good to set this to something short, specific, and informative.
- Documentation=: This directive provides a location for a list of URIs for documentation. These can be either internally available man pages or web accessible URLs. The systemctl status command will expose this information, allowing for easy discoverability.
- Requires=: This directive lists any units upon which this unit essentially depends. If the current unit is activated, the units listed here must successfully activate as well, else this unit will fail. These units are started in parallel with the current unit by default.
- Wants=: This directive is similar to Requires=, but less strict. Systemd will attempt to start any units listed here when this unit is activated. If these units are not found or fail to start, the current unit will continue to function. This is the recommended way to configure most dependency relationships. Again, this implies a parallel activation unless modified by other directives.
- BindsTo=: This directive is similar to Requires=, but also causes the current unit to stop when the associated unit terminates.
- Before=: The units listed in this directive will not be started until the current unit is marked as started if they are activated at the same time. This does not imply a dependency relationship and must be used in conjunction with one of the above directives if this is desired.
- After=: The units listed in this directive will be started before starting the current unit. This does not imply a dependency relationship and one must be established through the above directives if this is required.
- Conflicts=: This can be used to list units that cannot be run at the same time as the current unit. Starting a unit with this relationship will cause the other units to be stopped.
- Condition…=: There are a number of directives that start with Condition which allow the administrator to test certain conditions prior to starting the unit. This can be used to provide a generic unit file that will only be run when on appropriate systems. If the condition is not met, the unit is gracefully skipped.
- Assert…=: Similar to the directives that start with Condition, these directives check for different aspects of the running environment to decide whether the unit should activate. However, unlike the Condition directives, a negative result causes a failure with this directive.
[Install] Section Directives
- WantedBy=: The WantedBy= directive is the most common way to specify how a unit should be enabled. This directive allows you to specify a dependency relationship in a similar way to the Wants= directive does in the [Unit] section. The difference is that this directive is included in the ancillary unit allowing the primary unit listed to remain relatively clean. When a unit with this directive is enabled, a directory will be created within /etc/systemd/system named after the specified unit with .wants appended to the end. Within this, a symbolic link to the current unit will be created, creating the dependency. For instance, if the current unit has WantedBy=multi-user.target, a directory called multi-user.target.wants will be created within /etc/systemd/system (if not already available) and a symbolic link to the current unit will be placed within. Disabling this unit removes the link and removes the dependency relationship.
- RequiredBy=: This directive is very similar to the WantedBy= directive, but instead specifies a required dependency that will cause the activation to fail if not met. When enabled, a unit with this directive will create a directory ending with .requires.
- Alias=: This directive allows the unit to be enabled under another name as well. Among other uses, this allows multiple providers of a function to be available, so that related units can look for any provider of the common aliased name.
- Also=: This directive allows units to be enabled or disabled as a set. Supporting units that should always be available when this unit is active can be listed here. They will be managed as a group for installation tasks.
- DefaultInstance=: For template units (covered later) which can produce unit instances with unpredictable names, this can be used as a fallback value for the name if an appropriate name is not provided.
Unit-Specific Section Directives
Sandwiched between the previous two sections, you will likely find unit type-specific sections. The device, target, snapshot, and scope unit types have no unit-specific directives, and thus have no associated sections for their type.
The [Service] Section
The Type= directive can be one of the following:
- Type=
- simple: The main process of the service is specified in the start line. This is the default if the Type= and Busname= directives are not set, but the ExecStart= is set. Any communication should be handled outside of the unit through a second unit of the appropriate type (like through a .socket unit if this unit must communicate using sockets).
- forking: This service type is used when the service forks a child process, exiting the parent process almost immediately. This tells systemd that the process is still running even though the parent exited.
- oneshot: This type indicates that the process will be short-lived and that systemd should wait for the process to exit before continuing on with other units. This is the default Type= and ExecStart= are not set. It is used for one-off tasks.
- dbus: This indicates that unit will take a name on the D-Bus bus. When this happens, systemd will continue to process the next unit.
- notify: This indicates that the service will issue a notification when it has finished starting up. The systemd process will wait for this to happen before proceeding to other units.
- idle: This indicates that the service will not be run until all jobs are dispatched.
- RemainAfterExit=: This directive is commonly used with the oneshot type. It indicates that the service should be considered active even after the process exits.
- PIDFile=: If the service type is marked as “forking”, this directive is used to set the path of the file that should contain the process ID number of the main child that should be monitored.
- BusName=: This directive should be set to the D-Bus bus name that the service will attempt to acquire when using the “dbus” service type.
-
NotifyAccess=: This specifies access to the socket that should be used to listen for notifications when the “notify” service type is selected This can be “none”, “main”, or “all. The default, “none”, ignores all status messages. The “main” option will listen to messages from the main process and the “all” option will cause all members of the service’s control group to be processed.
- ExecStart=: This specifies the full path and the arguments of the command to be executed to start the process. This may only be specified once (except for “oneshot” services). If the path to the command is preceded by a dash “-” character, non-zero exit statuses will be accepted without marking the unit activation as failed.
- ExecStartPre=: This can be used to provide additional commands that should be executed before the main process is started. This can be used multiple times. Again, commands must specify a full path and they can be preceded by “-” to indicate that the failure of the command will be tolerated.
- ExecStartPost=: This has the same exact qualities as ExecStartPre= except that it specifies commands that will be run after the main process is started.
- ExecReload=: This optional directive indicates the command necessary to reload the configuration of the service if available.
- ExecStop=: This indicates the command needed to stop the service. If this is not given, the process will be killed immediately when the service is stopped.
- ExecStopPost=: This can be used to specify commands to execute following the stop command.
- RestartSec=: If automatically restarting the service is enabled, this specifies the amount of time to wait before attempting to restart the service.
- Restart=: This indicates the circumstances under which systemd will attempt to automatically restart the service. This can be set to values like “always”, “on-success”, “on-failure”, “on-abnormal”, “on-abort”, or “on-watchdog”. These will trigger a restart according to the way that the service was stopped.
- TimeoutSec=: This configures the amount of time that systemd will wait when stopping or stopping the service before marking it as failed or forcefully killing it. You can set separate timeouts with TimeoutStartSec= and TimeoutStopSec= as well.
The [Socket] Section
The [Mount] Section
The [Automount] Section
The [Swap] Section
The [Path] Section
The [Timer] Section
The [Slice] Section
案例分析
Clock drift
ntpd is preferred over ntpdate:
NTPDATE corrects the system time instantaneously, which can cause problems with some software (e.g. destroying a session which now appears old). NTPD intentionally corrects the system time slowly, avoiding that problem. You can add the -g switch when starting NTPD to allow NTPD to make the first time update a big one which is more or less equivalent to running ntpdate once before starting NTPD, which at one time was recommended practice.
Linux内核架构和工作原理 https://mp.weixin.qq.com/s/Vrl_pUTRY0bLUN0fQYynDQ
Linux 问题故障定位 https://mp.weixin.qq.com/s/j1Hx199SWasofY_br0Mktg