回目录 《jmeter4.0 Load test》
# 1. Basics Concept
# 1.1 Measurements / metrics
Load: Request per second Active users Throughput Performance: percentile for Successful requests / success rate/ error rate Max/Min/Avg response time Key metrics for PostgreSQL monitoring https://www.datadoghq.com/blog/postgresql-monitoring/
# 1.2 Test Plan
https://jmeter.apache.org/usermanual/index.html https://jmeter.apache.org/usermanual/test_plan.html
Test Plan object Functional Testing
Thread Group Set the number of threads Set the ramp-up period Set the number of times to execute the test
Controllers Samplers https://jmeter.apache.org/usermanual/component_reference.html#samplers Logical Controllers Test Fragments
Listeners https://jmeter.apache.org/usermanual/component_reference.html#listeners
View Results Tree Listener Graph Results Listener https://jmeter.apache.org/usermanual/component_reference.html#Graph_Results
Timers Assertions Configuration Elements works closely with a Sampler
Pre-Processor Elements Post-Processor Elements Execution Order Scoping Rules Properties and Variables Using Variables to parameterise tests
# 2 Hands on
# 2.1 Setup
Download:http://jmeter.apache.org/download_jmeter.cgi
/opt/loadtest
sudo chown
GUI Mode
Windows: cd \apache-jmeter-4.0\bin jmeter Linux /opt/loadtest/apache-jmeter-4.0/bin/jmeter.sh &
Non GUI Mode
jmeter -n -t testplan.jmx -l log.jtl -e -o resultReport -n specifies JMeter is to run in non-gui mode ../apache-jmeter-4.0/bin/jmeter -n -t Pgsql_Stg_TestPlan.jmx -l log.jtl -e -o resultReport
Server Mode (distributed testing)
For distributed testing, run JMeter in server mode on the remote node(s), and then control the server(s) from the GUI. You can also use non-GUI mode to run remote tests. To start the server(s), run jmeter-server[.bat] on each server host. https://jmeter.apache.org/usermanual/jmeter_distributed_testing_step_by_step.html
# 2.2 DataBase Test Plan
Refer http://jmeter.apache.org/usermanual/build-db-test-plan.html https://stackoverflow.com/questions/25525089/how-to-do-performance-test-for-a-stored-procedure-via-jmeter-2-9 https://hiromia.blogspot.sg/2015/03/how-to-perform-load-testing-on.html https://jdbc.postgresql.org/documentation/80/callproc.html
Samples SQL query performance test with JMeter http://scornik.blogspot.com/2011/05/sql-query-performance-test-with-jmeter.html http://nonfunctionaltestingtools.blogspot.com/2015/10/database-test-plan-with-jmeter.html https://stackoverflow.com/questions/45312779/readable-output-from-oracle-procedure-that-returns-a-cursor-in-jmeter
There are two ways to create a database test plan, use build-in template “JDBC Load Test” Or follow the manually instruction below:
- Add JDBC driver to /lib
Postgresql jdbc driver 42.2.5: https://jdbc.postgresql.org/download.html
Adding Users (Thread Group)
Adding jdbc config & request & variables
Query request: select count(1) from table t1 inner join user t2 on t1.userid=t2.userid where t2.col2=? order by col3
postgresql: {?= call sproc(?)} OUT,${input1} OUT REF_CURSOR,VARCHAR
Oracle: call sproc(?,?) ${input1},OUT VARCHAR,OUT -10
If there is any variables, the Query type cannot select “Select Statement”, it should be “Callable Statement” !
- Adding Listener to View/Store the Test Results i) Summary Report and View Result Tree https://jmeter.apache.org/usermanual/component_reference.html#Summary_Report

ii) RealTime with Grafana
https://jmeter.apache.org/usermanual/realtime-results.html
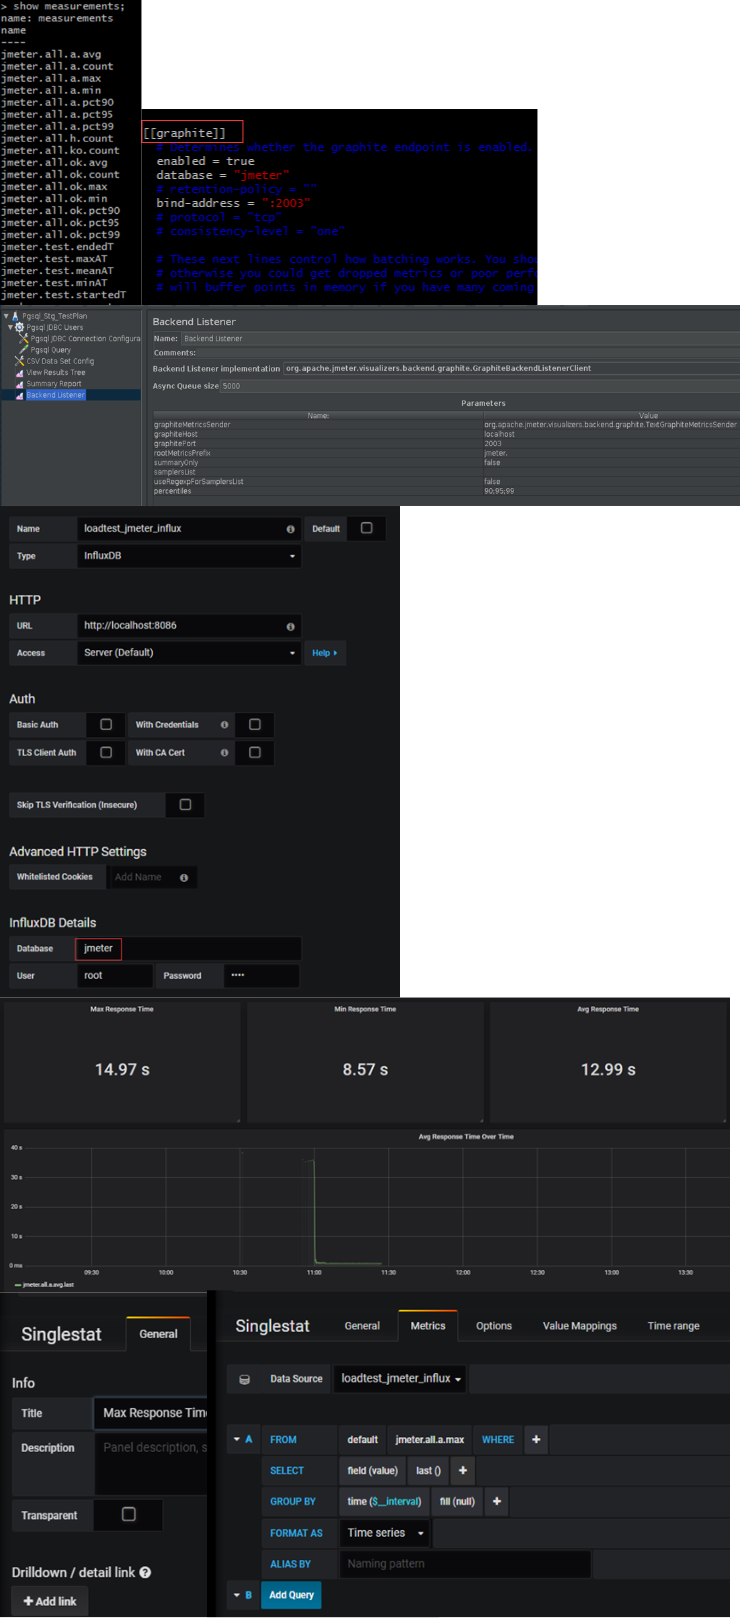
Method 1: write to fluxdb by graphitePort 2003
Step 1: create influxdb jmeter and config influxdb.conf
Based on <</workspace/setup:Grafana>>,
sudo docker run -d -p 8080:8080 -p 8086:8086 -p 9001:9001 -p 3001:3000 -p 2003:2003 --name pw2 cybertec/pgwatch2
Expose port 2003 to host, so that jmeter running on host can access 2003 port which proxy to docker
sudo docker exec -ti pw2 /bin/bash
influx -precision rfc3339
> create database grafana; (if you want to store dashboard json into influxdb)
create database jmeter;
Config /etc/influxdb/influxdb.conf
Restart influxdb or docker Step 2: add Backend Listener Host: localhost, Port:2003,
Step 3: Config and Add Grafana dashboard Add DataSource:
And then add graph Refer to the video from http://www.testautomationguru.com/jmeter-real-time-results-influxdb-grafana/

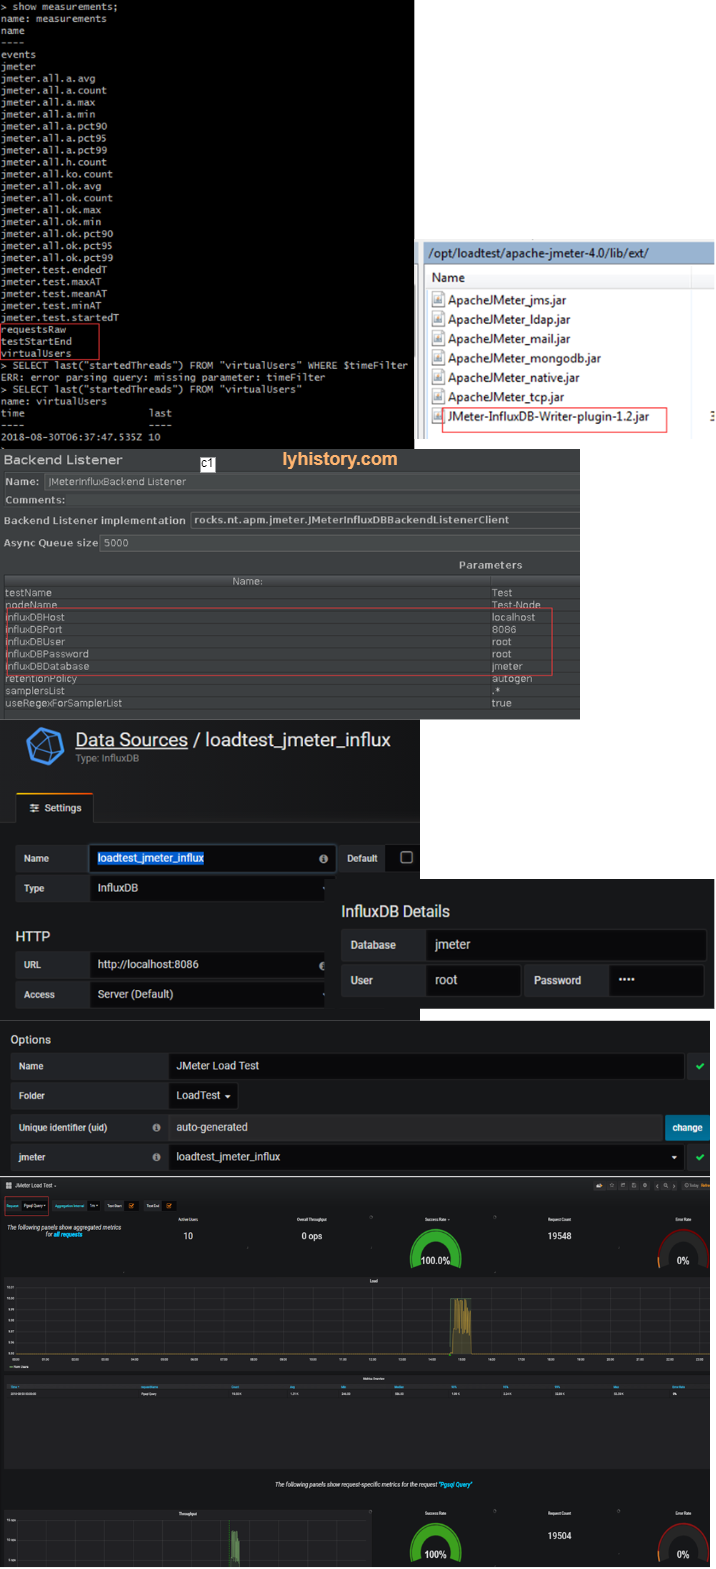
Method 2: write to influxdb directly https://grafana.com/dashboards/1152
Step 1: same
Step 2: add jar extension and JMeterInfluxDBBackendListenerClient
Download the JMeter-InfluxBD-Writer https://github.com/NovaTecConsulting/JMeter-InfluxDB-Writer/releases and paste the jar into the /lib/ext directory of your JMeter installation. (Then Restart JMeter)
In your JMeter load script add a Backend Listener node (Add -> Listener -> Backend Listener) Select JMeterInfluxDBBackendListenerClient for the Backend Listener implementation option Provide in the Parameters table your influxDB settings, provide a name for the test, and specify which samplers to record.
Step 3: Config Grafana Add DataSource
download dashboard json and import by uploadinghttps://grafana.com/dashboards/1152

- assertion https://stackoverflow.com/questions/39573591/count-the-number-of-occurences-of-a-string-in-response-data https://jmeter.apache.org/usermanual/component_reference.html#JDBC_Request
# 3. Troubleshooting
Constant Throughput Timer https://www.blazemeter.com/blog/how-use-jmeters-throughput-constant-timer
Error java.sql.SQLException: ORA-00911: invalid character Remove or add ; at the end of the query statement;
Can we run two thread groups parallely in a single test plan in Jmeter? https://stackoverflow.com/questions/24239003/can-we-run-two-thread-groups-parallely-in-a-single-test-plan-in-jmeter jmeter response times using Response Time over Time https://stackoverflow.com/questions/28368011/jmeter-response-times-using-response-time-over-time
to Generate html report, change LoopCount from forever to limited loops
# 4. Advance
# 4.1 Features
Recording Tests https://jmeter.apache.org/usermanual/jmeter_proxy_step_by_step.html Distributed Testing https://jmeter.apache.org/usermanual/jmeter_distributed_testing_step_by_step.html
# 4.2 Plugins
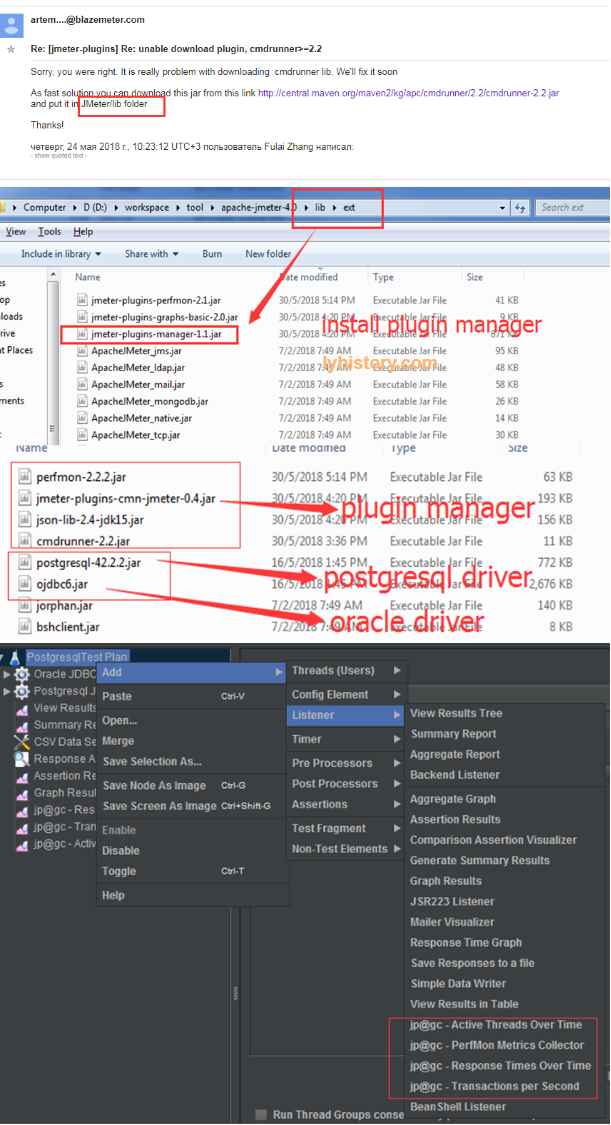
https://jmeter-plugins.org/install/Install/ Response Times Over Time https://jmeter-plugins.org/wiki/ResponseTimesOverTime/
Servers Performance Monitoring https://jmeter-plugins.org/wiki/PerfMon/
?#issues: unable download plugin, cmdrunner>=2.2 https://groups.google.com/forum/#!topic/jmeter-plugins/jVZ1UKPyBZY

# 4.3 Coding with Jmeter
For mysql: https://docs.oracle.com/javase/tutorial/jdbc/basics/index.html For postgresql: https://jdbc.postgresql.org/documentation/documentation.html https://jdbc.postgresql.org/documentation/head/index.html
import java.sql.*;
import org.apache.jmeter.protocol.jdbc.config.DataSourceElement;

ResultSet rs = null;
ResultSetMetaData rsmd = null;
CallableStatement stmt;
Connection conn=null;
try {

    Class.forName("org.postgresql.Driver");
    // "myConnConfigName" is the 'JDBC Connection Configuration' variable name
    log.info("#####################################");
    //conn = DataSourceElement.getConnection("postgresqlConfig");
    String url = "jdbc:postgresql://10.20.70.168:6432/oureadb?user=ourea_exec&password=ourea_exec";
    conn = DriverManager.getConnection(url);
    conn.setAutoCommit(false);
    log.info("----------------------a");
	stmt = conn.prepareCall("{? = CALL pg_func_loadtest_get_userreport_by_webcode(?) }");

	stmt.registerOutParameter(1, Types.OTHER);
	stmt.setString(2, "SSS988");
	stmt.execute();
    rs = (ResultSet) stmt.getObject(1);
	while (rs.next()) {
    	rsmd = rs.getMetaData();

    	log.info("ColumnCount:" + rsmd.getColumnCount().toString());
    	log.info("RowNo:" + rs.getRow().toString());

    	// TODO: Store data.
    	//   	Loop through columns with rs.getString(i);
	}

}
catch(Throwable ex) {
    log.error("###################################");
	log.error("Error message: ", ex);
	log.error("###################################");
	throw ex;
}
finally {
	if (rs != null) {
    	rs.close();
	}
	if (stmt != null) {
    	stmt.close();
	}
	if (conn != null) {
    	conn.close();
	}
}
?#issues unresolved: cannot call sp Keywords tried: registerOutParameter INOUT refcursor https://jdbc.postgresql.org/documentation/head/callproc.html